Puget Sound Salish vs Immigrants from Norway Female Unemployment
COMPARE
Puget Sound Salish
Immigrants from Norway
Female Unemployment
Female Unemployment Comparison
Puget Sound Salish
Immigrants from Norway
5.1%
FEMALE UNEMPLOYMENT
93.0/ 100
METRIC RATING
108th/ 347
METRIC RANK
5.2%
FEMALE UNEMPLOYMENT
79.4/ 100
METRIC RATING
146th/ 347
METRIC RANK
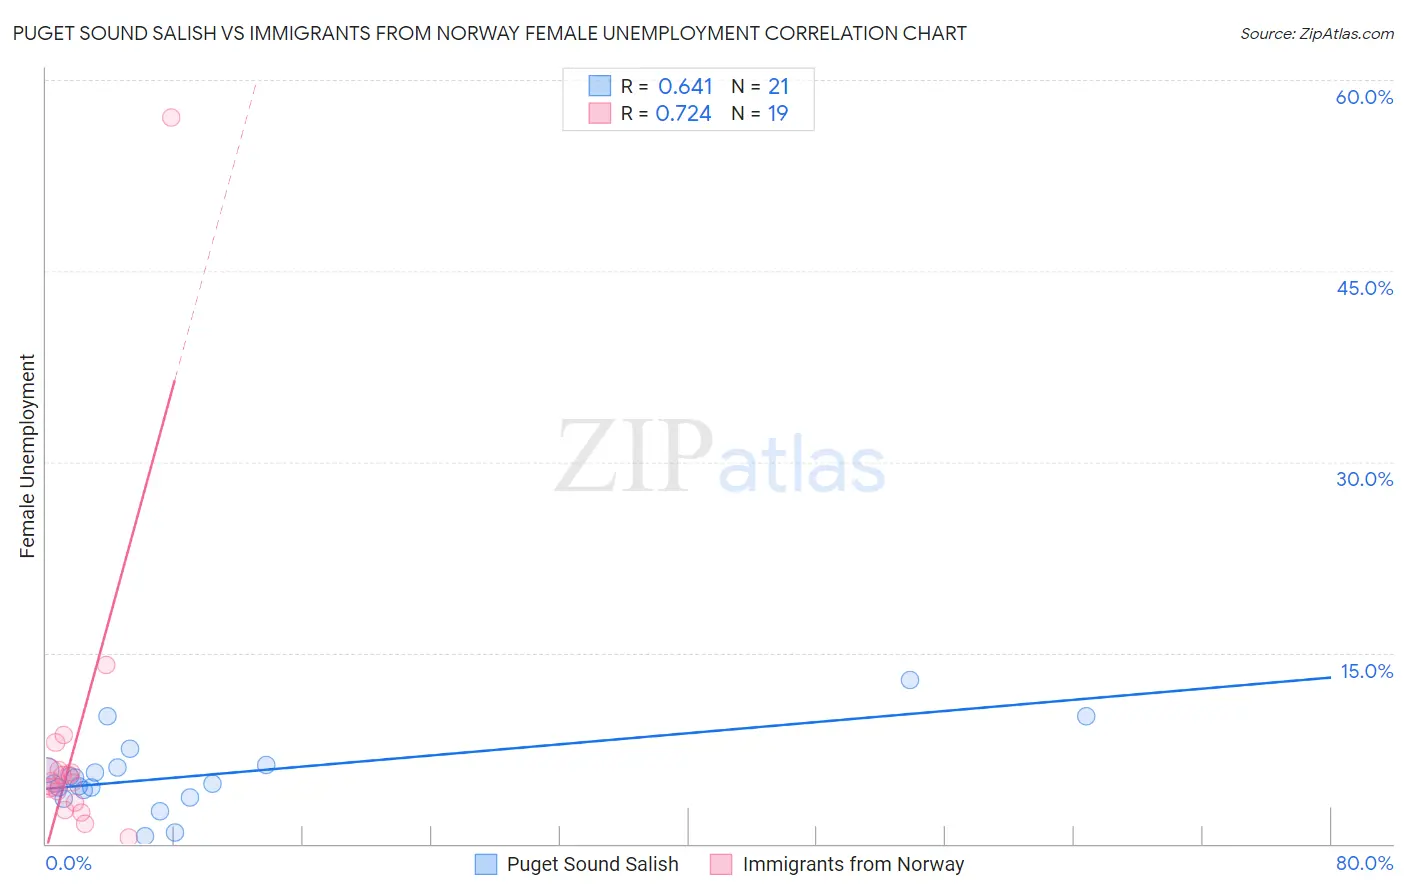
Puget Sound Salish vs Immigrants from Norway Female Unemployment Correlation Chart
The statistical analysis conducted on geographies consisting of 46,055,319 people shows a significant positive correlation between the proportion of Puget Sound Salish and unemploymnet rate among females in the United States with a correlation coefficient (R) of 0.641 and weighted average of 5.1%. Similarly, the statistical analysis conducted on geographies consisting of 116,500,173 people shows a strong positive correlation between the proportion of Immigrants from Norway and unemploymnet rate among females in the United States with a correlation coefficient (R) of 0.724 and weighted average of 5.2%, a difference of 1.9%.
Female Unemployment Correlation Summary
| Measurement | Puget Sound Salish | Immigrants from Norway |
| Minimum | 0.60% | 0.50% |
| Maximum | 12.9% | 57.1% |
| Range | 12.3% | 56.6% |
| Mean | 5.4% | 7.8% |
| Median | 4.8% | 4.9% |
| Interquartile 25% (IQ1) | 3.9% | 3.2% |
| Interquartile 75% (IQ3) | 6.1% | 5.8% |
| Interquartile Range (IQR) | 2.2% | 2.6% |
| Standard Deviation (Sample) | 2.9% | 12.3% |
| Standard Deviation (Population) | 2.8% | 12.0% |
Similar Demographics by Female Unemployment
Demographics Similar to Puget Sound Salish by Female Unemployment
In terms of female unemployment, the demographic groups most similar to Puget Sound Salish are Immigrants from Switzerland (5.1%, a difference of 0.020%), Immigrants from Eastern Africa (5.1%, a difference of 0.040%), Paraguayan (5.1%, a difference of 0.050%), Immigrants from England (5.0%, a difference of 0.14%), and Macedonian (5.1%, a difference of 0.14%).
| Demographics | Rating | Rank | Female Unemployment |
| Immigrants | Czechoslovakia | 95.0 /100 | #101 | Exceptional 5.0% |
| Immigrants | Kenya | 94.8 /100 | #102 | Exceptional 5.0% |
| Somalis | 94.6 /100 | #103 | Exceptional 5.0% |
| Kenyans | 93.7 /100 | #104 | Exceptional 5.0% |
| Immigrants | England | 93.6 /100 | #105 | Exceptional 5.0% |
| Paraguayans | 93.2 /100 | #106 | Exceptional 5.1% |
| Immigrants | Switzerland | 93.1 /100 | #107 | Exceptional 5.1% |
| Puget Sound Salish | 93.0 /100 | #108 | Exceptional 5.1% |
| Immigrants | Eastern Africa | 92.8 /100 | #109 | Exceptional 5.1% |
| Macedonians | 92.4 /100 | #110 | Exceptional 5.1% |
| Immigrants | Burma/Myanmar | 92.3 /100 | #111 | Exceptional 5.1% |
| Estonians | 92.1 /100 | #112 | Exceptional 5.1% |
| Immigrants | Saudi Arabia | 91.2 /100 | #113 | Exceptional 5.1% |
| Immigrants | Turkey | 91.0 /100 | #114 | Exceptional 5.1% |
| Lebanese | 91.0 /100 | #115 | Exceptional 5.1% |
Demographics Similar to Immigrants from Norway by Female Unemployment
In terms of female unemployment, the demographic groups most similar to Immigrants from Norway are Immigrants from Oceania (5.2%, a difference of 0.010%), Argentinean (5.2%, a difference of 0.020%), Immigrants from Argentina (5.2%, a difference of 0.060%), Immigrants from Jordan (5.1%, a difference of 0.10%), and Asian (5.2%, a difference of 0.10%).
| Demographics | Rating | Rank | Female Unemployment |
| Immigrants | Eastern Asia | 83.0 /100 | #139 | Excellent 5.1% |
| Immigrants | France | 82.7 /100 | #140 | Excellent 5.1% |
| Immigrants | Eastern Europe | 81.5 /100 | #141 | Excellent 5.1% |
| Palestinians | 80.8 /100 | #142 | Excellent 5.1% |
| Immigrants | Kazakhstan | 80.7 /100 | #143 | Excellent 5.1% |
| Immigrants | Jordan | 80.4 /100 | #144 | Excellent 5.1% |
| Immigrants | Oceania | 79.5 /100 | #145 | Good 5.2% |
| Immigrants | Norway | 79.4 /100 | #146 | Good 5.2% |
| Argentineans | 79.2 /100 | #147 | Good 5.2% |
| Immigrants | Argentina | 78.7 /100 | #148 | Good 5.2% |
| Asians | 78.3 /100 | #149 | Good 5.2% |
| Egyptians | 78.3 /100 | #150 | Good 5.2% |
| Immigrants | China | 75.9 /100 | #151 | Good 5.2% |
| Immigrants | Italy | 75.0 /100 | #152 | Good 5.2% |
| Immigrants | Greece | 74.9 /100 | #153 | Good 5.2% |