Pueblo vs Bhutanese Unemployment
COMPARE
Pueblo
Bhutanese
Unemployment
Unemployment Comparison
Pueblo
Bhutanese
7.2%
UNEMPLOYMENT
0.0/ 100
METRIC RATING
327th/ 347
METRIC RANK
4.9%
UNEMPLOYMENT
99.0/ 100
METRIC RATING
59th/ 347
METRIC RANK
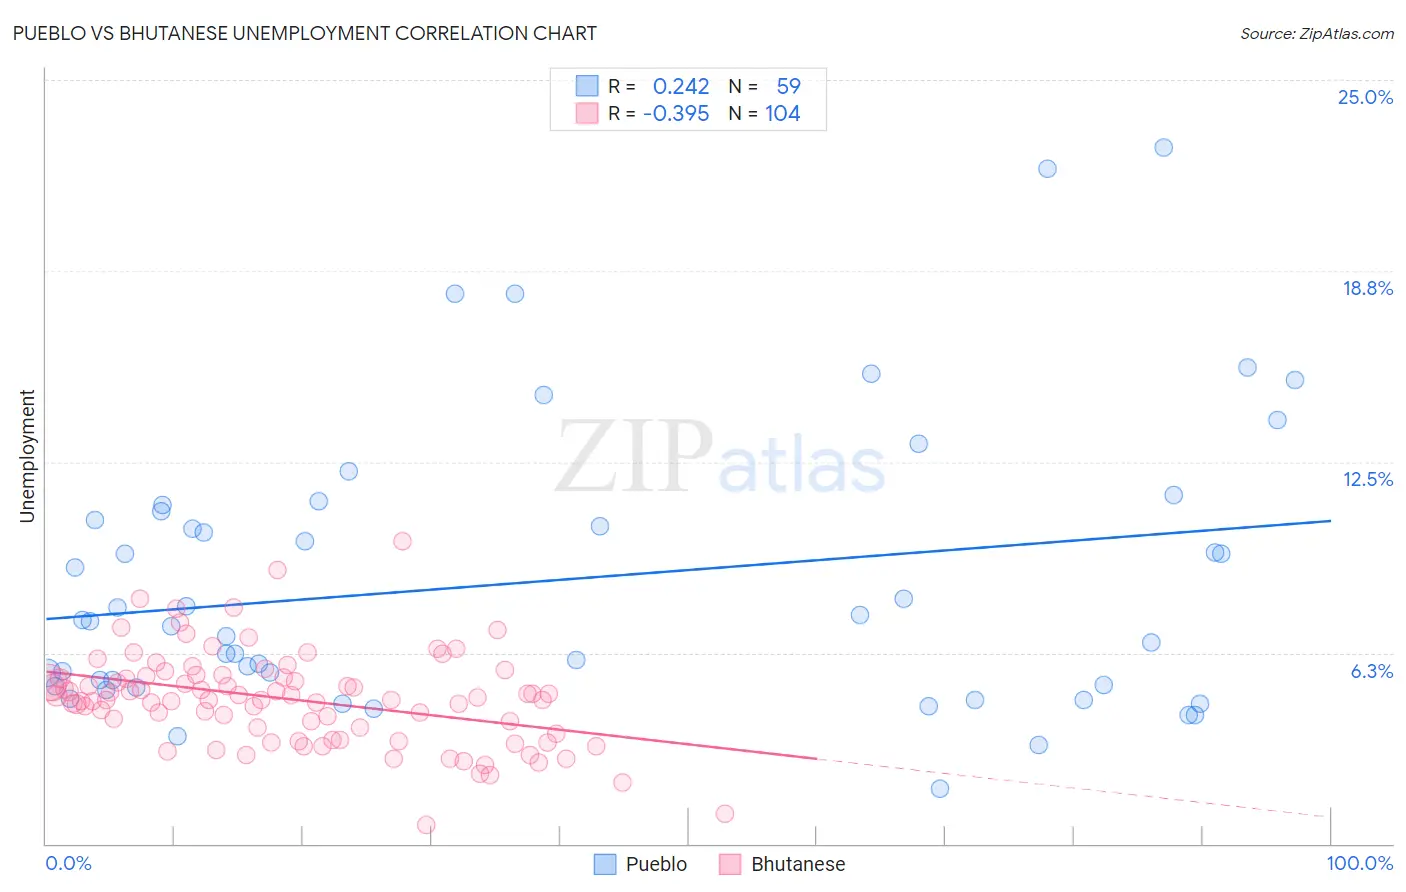
Pueblo vs Bhutanese Unemployment Correlation Chart
The statistical analysis conducted on geographies consisting of 120,042,060 people shows a weak positive correlation between the proportion of Pueblo and unemployment in the United States with a correlation coefficient (R) of 0.242 and weighted average of 7.2%. Similarly, the statistical analysis conducted on geographies consisting of 454,875,452 people shows a mild negative correlation between the proportion of Bhutanese and unemployment in the United States with a correlation coefficient (R) of -0.395 and weighted average of 4.9%, a difference of 46.3%.
Unemployment Correlation Summary
| Measurement | Pueblo | Bhutanese |
| Minimum | 1.8% | 0.60% |
| Maximum | 22.8% | 9.9% |
| Range | 21.0% | 9.3% |
| Mean | 8.6% | 4.7% |
| Median | 7.3% | 4.8% |
| Interquartile 25% (IQ1) | 5.2% | 3.7% |
| Interquartile 75% (IQ3) | 10.9% | 5.5% |
| Interquartile Range (IQR) | 5.7% | 1.8% |
| Standard Deviation (Sample) | 4.6% | 1.5% |
| Standard Deviation (Population) | 4.6% | 1.5% |
Similar Demographics by Unemployment
Demographics Similar to Pueblo by Unemployment
In terms of unemployment, the demographic groups most similar to Pueblo are Paiute (7.1%, a difference of 0.53%), Tsimshian (7.2%, a difference of 0.91%), Alaska Native (7.2%, a difference of 1.2%), Native/Alaskan (7.0%, a difference of 1.7%), and Immigrants from Armenia (7.0%, a difference of 2.3%).
| Demographics | Rating | Rank | Unemployment |
| Immigrants | St. Vincent and the Grenadines | 0.0 /100 | #320 | Tragic 6.9% |
| Immigrants | Guyana | 0.0 /100 | #321 | Tragic 6.9% |
| Guyanese | 0.0 /100 | #322 | Tragic 6.9% |
| Immigrants | Grenada | 0.0 /100 | #323 | Tragic 6.9% |
| Immigrants | Armenia | 0.0 /100 | #324 | Tragic 7.0% |
| Natives/Alaskans | 0.0 /100 | #325 | Tragic 7.0% |
| Paiute | 0.0 /100 | #326 | Tragic 7.1% |
| Pueblo | 0.0 /100 | #327 | Tragic 7.2% |
| Tsimshian | 0.0 /100 | #328 | Tragic 7.2% |
| Alaska Natives | 0.0 /100 | #329 | Tragic 7.2% |
| Yakama | 0.0 /100 | #330 | Tragic 7.3% |
| Dominicans | 0.0 /100 | #331 | Tragic 7.4% |
| Sioux | 0.0 /100 | #332 | Tragic 7.4% |
| Immigrants | Dominican Republic | 0.0 /100 | #333 | Tragic 7.4% |
| Apache | 0.0 /100 | #334 | Tragic 7.4% |
Demographics Similar to Bhutanese by Unemployment
In terms of unemployment, the demographic groups most similar to Bhutanese are Greek (4.9%, a difference of 0.030%), Immigrants from Netherlands (4.9%, a difference of 0.050%), Cambodian (4.9%, a difference of 0.050%), Icelander (4.9%, a difference of 0.060%), and Immigrants from Bulgaria (4.9%, a difference of 0.070%).
| Demographics | Rating | Rank | Unemployment |
| Whites/Caucasians | 99.2 /100 | #52 | Exceptional 4.9% |
| Immigrants | Zimbabwe | 99.2 /100 | #53 | Exceptional 4.9% |
| Eastern Europeans | 99.2 /100 | #54 | Exceptional 4.9% |
| Australians | 99.2 /100 | #55 | Exceptional 4.9% |
| Celtics | 99.1 /100 | #56 | Exceptional 4.9% |
| Immigrants | Singapore | 99.1 /100 | #57 | Exceptional 4.9% |
| Greeks | 99.0 /100 | #58 | Exceptional 4.9% |
| Bhutanese | 99.0 /100 | #59 | Exceptional 4.9% |
| Immigrants | Netherlands | 99.0 /100 | #60 | Exceptional 4.9% |
| Cambodians | 99.0 /100 | #61 | Exceptional 4.9% |
| Icelanders | 98.9 /100 | #62 | Exceptional 4.9% |
| Immigrants | Bulgaria | 98.9 /100 | #63 | Exceptional 4.9% |
| Italians | 98.9 /100 | #64 | Exceptional 4.9% |
| Immigrants | Canada | 98.8 /100 | #65 | Exceptional 4.9% |
| Slovaks | 98.7 /100 | #66 | Exceptional 4.9% |