Immigrants from Philippines vs Subsaharan African Unemployment
COMPARE
Immigrants from Philippines
Subsaharan African
Unemployment
Unemployment Comparison
Immigrants from Philippines
Sub-Saharan Africans
5.4%
UNEMPLOYMENT
10.4/ 100
METRIC RATING
221st/ 347
METRIC RANK
5.8%
UNEMPLOYMENT
0.1/ 100
METRIC RATING
259th/ 347
METRIC RANK
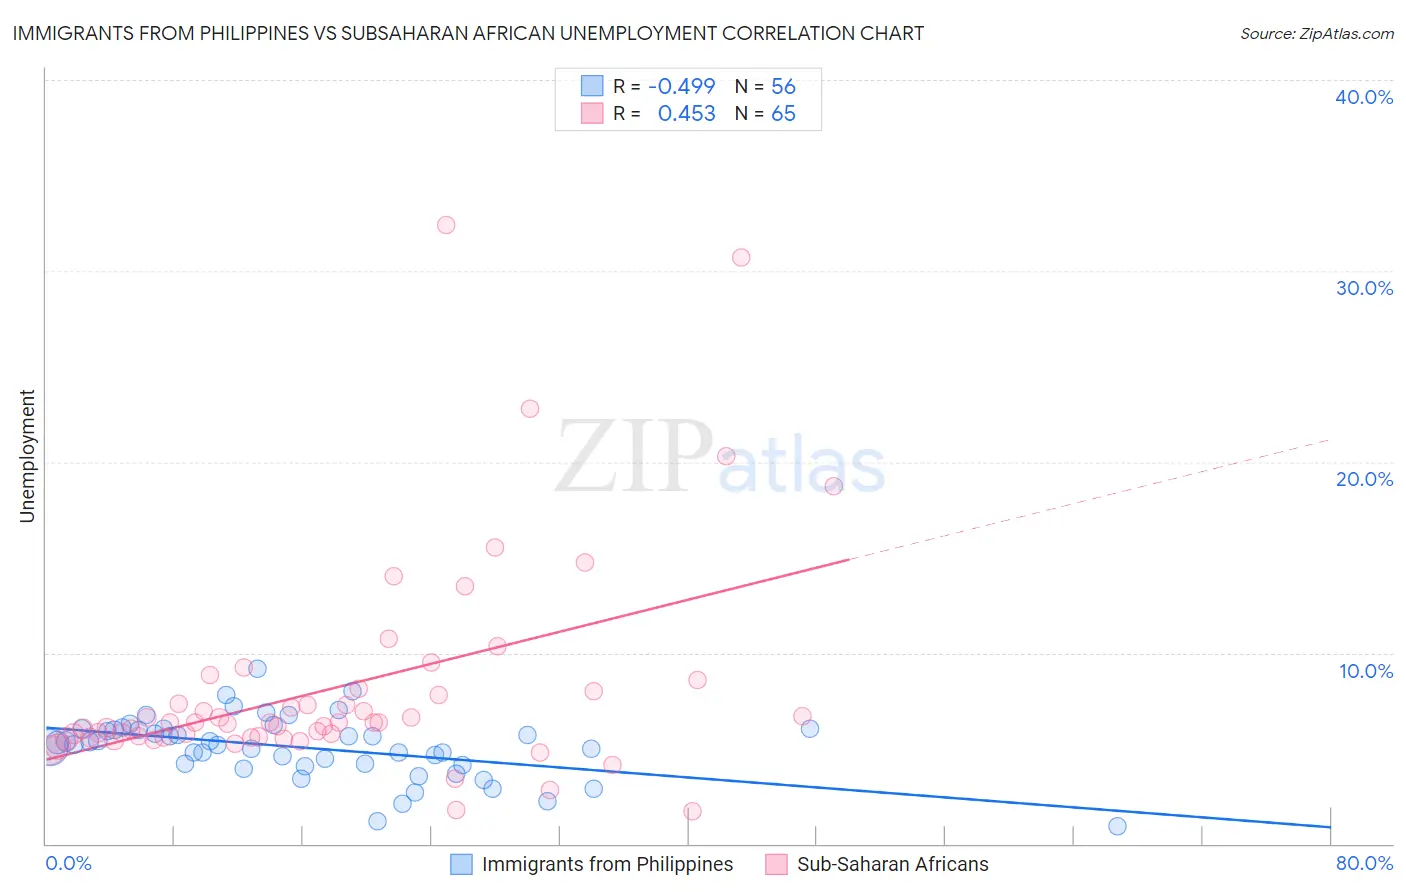
Immigrants from Philippines vs Subsaharan African Unemployment Correlation Chart
The statistical analysis conducted on geographies consisting of 470,568,280 people shows a moderate negative correlation between the proportion of Immigrants from Philippines and unemployment in the United States with a correlation coefficient (R) of -0.499 and weighted average of 5.4%. Similarly, the statistical analysis conducted on geographies consisting of 507,124,054 people shows a moderate positive correlation between the proportion of Sub-Saharan Africans and unemployment in the United States with a correlation coefficient (R) of 0.453 and weighted average of 5.8%, a difference of 6.6%.
Unemployment Correlation Summary
| Measurement | Immigrants from Philippines | Subsaharan African |
| Minimum | 0.90% | 1.7% |
| Maximum | 9.1% | 32.4% |
| Range | 8.2% | 30.7% |
| Mean | 5.0% | 8.2% |
| Median | 5.3% | 6.3% |
| Interquartile 25% (IQ1) | 4.1% | 5.6% |
| Interquartile 75% (IQ3) | 6.0% | 8.0% |
| Interquartile Range (IQR) | 1.8% | 2.5% |
| Standard Deviation (Sample) | 1.6% | 5.7% |
| Standard Deviation (Population) | 1.6% | 5.7% |
Similar Demographics by Unemployment
Demographics Similar to Immigrants from Philippines by Unemployment
In terms of unemployment, the demographic groups most similar to Immigrants from Philippines are Iroquois (5.4%, a difference of 0.020%), Soviet Union (5.4%, a difference of 0.040%), Bangladeshi (5.4%, a difference of 0.12%), Seminole (5.4%, a difference of 0.21%), and Israeli (5.4%, a difference of 0.28%).
| Demographics | Rating | Rank | Unemployment |
| Immigrants | Costa Rica | 15.2 /100 | #214 | Poor 5.4% |
| Delaware | 14.7 /100 | #215 | Poor 5.4% |
| Immigrants | South America | 13.5 /100 | #216 | Poor 5.4% |
| Immigrants | Albania | 13.5 /100 | #217 | Poor 5.4% |
| Choctaw | 12.7 /100 | #218 | Poor 5.4% |
| Bangladeshis | 11.2 /100 | #219 | Poor 5.4% |
| Soviet Union | 10.6 /100 | #220 | Poor 5.4% |
| Immigrants | Philippines | 10.4 /100 | #221 | Poor 5.4% |
| Iroquois | 10.3 /100 | #222 | Poor 5.4% |
| Seminole | 9.2 /100 | #223 | Tragic 5.4% |
| Israelis | 8.8 /100 | #224 | Tragic 5.4% |
| South American Indians | 7.8 /100 | #225 | Tragic 5.5% |
| Samoans | 7.1 /100 | #226 | Tragic 5.5% |
| Immigrants | Lebanon | 7.0 /100 | #227 | Tragic 5.5% |
| Guamanians/Chamorros | 6.3 /100 | #228 | Tragic 5.5% |
Demographics Similar to Sub-Saharan Africans by Unemployment
In terms of unemployment, the demographic groups most similar to Sub-Saharan Africans are Immigrants from Uzbekistan (5.8%, a difference of 0.020%), Immigrants from Guatemala (5.8%, a difference of 0.040%), Immigrants from Bahamas (5.8%, a difference of 0.12%), Sierra Leonean (5.8%, a difference of 0.14%), and Salvadoran (5.8%, a difference of 0.17%).
| Demographics | Rating | Rank | Unemployment |
| Hondurans | 0.3 /100 | #252 | Tragic 5.7% |
| Central Americans | 0.3 /100 | #253 | Tragic 5.7% |
| Immigrants | Honduras | 0.3 /100 | #254 | Tragic 5.7% |
| Immigrants | Portugal | 0.2 /100 | #255 | Tragic 5.7% |
| Guatemalans | 0.2 /100 | #256 | Tragic 5.8% |
| Yaqui | 0.2 /100 | #257 | Tragic 5.8% |
| Immigrants | Bahamas | 0.1 /100 | #258 | Tragic 5.8% |
| Sub-Saharan Africans | 0.1 /100 | #259 | Tragic 5.8% |
| Immigrants | Uzbekistan | 0.1 /100 | #260 | Tragic 5.8% |
| Immigrants | Guatemala | 0.1 /100 | #261 | Tragic 5.8% |
| Sierra Leoneans | 0.1 /100 | #262 | Tragic 5.8% |
| Salvadorans | 0.1 /100 | #263 | Tragic 5.8% |
| Immigrants | Liberia | 0.1 /100 | #264 | Tragic 5.8% |
| Nigerians | 0.1 /100 | #265 | Tragic 5.8% |
| Mexican American Indians | 0.1 /100 | #266 | Tragic 5.8% |