Immigrants from Northern Africa vs Subsaharan African Unemployment
COMPARE
Immigrants from Northern Africa
Subsaharan African
Unemployment
Unemployment Comparison
Immigrants from Northern Africa
Sub-Saharan Africans
5.2%
UNEMPLOYMENT
71.3/ 100
METRIC RATING
155th/ 347
METRIC RANK
5.8%
UNEMPLOYMENT
0.1/ 100
METRIC RATING
259th/ 347
METRIC RANK
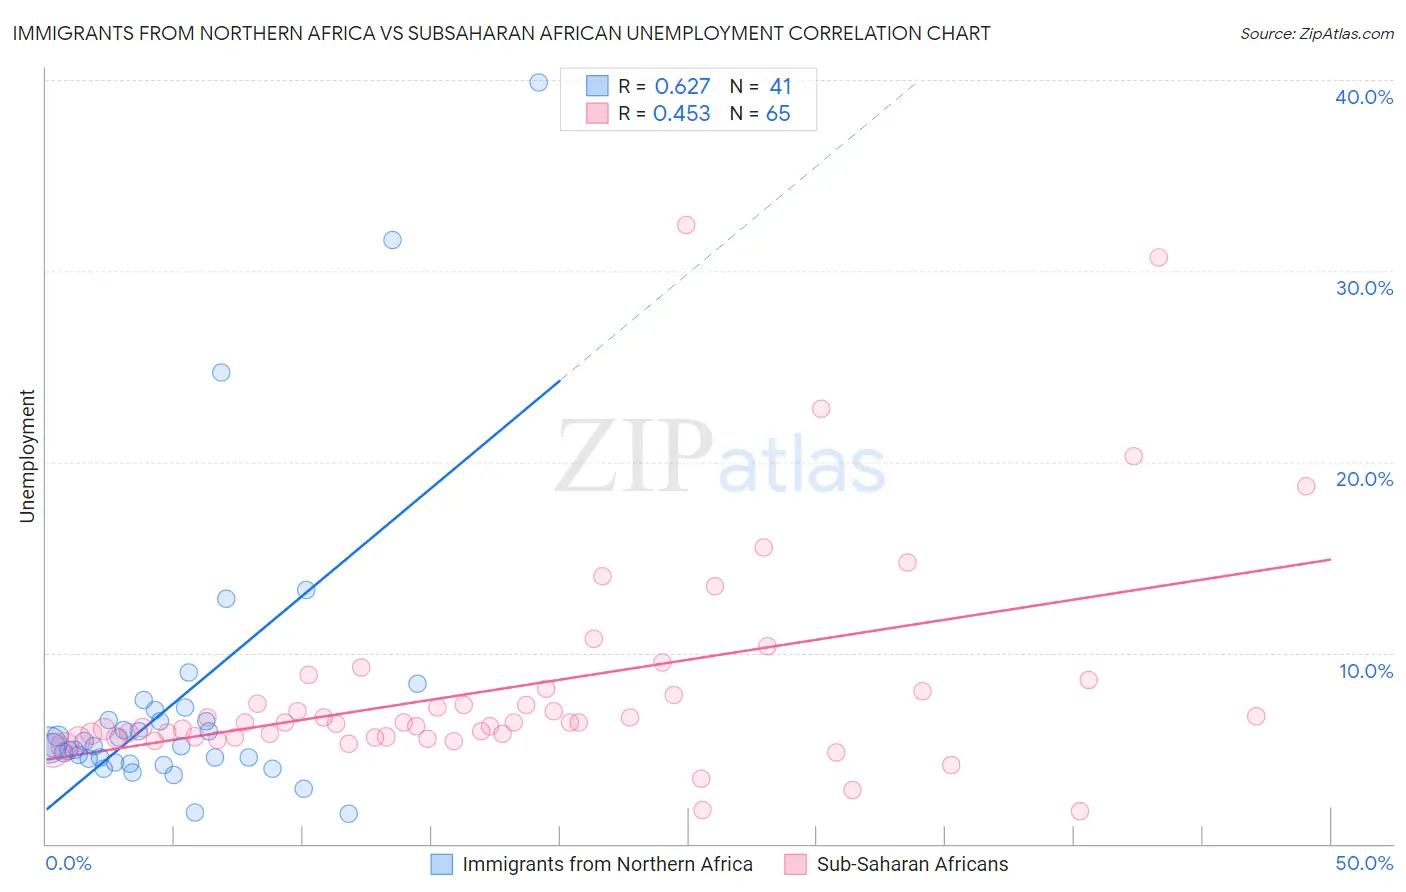
Immigrants from Northern Africa vs Subsaharan African Unemployment Correlation Chart
The statistical analysis conducted on geographies consisting of 321,091,849 people shows a significant positive correlation between the proportion of Immigrants from Northern Africa and unemployment in the United States with a correlation coefficient (R) of 0.627 and weighted average of 5.2%. Similarly, the statistical analysis conducted on geographies consisting of 507,124,054 people shows a moderate positive correlation between the proportion of Sub-Saharan Africans and unemployment in the United States with a correlation coefficient (R) of 0.453 and weighted average of 5.8%, a difference of 11.7%.
Unemployment Correlation Summary
| Measurement | Immigrants from Northern Africa | Subsaharan African |
| Minimum | 1.6% | 1.7% |
| Maximum | 39.9% | 32.4% |
| Range | 38.3% | 30.7% |
| Mean | 7.5% | 8.2% |
| Median | 5.2% | 6.3% |
| Interquartile 25% (IQ1) | 4.4% | 5.6% |
| Interquartile 75% (IQ3) | 6.7% | 8.0% |
| Interquartile Range (IQR) | 2.4% | 2.5% |
| Standard Deviation (Sample) | 7.5% | 5.7% |
| Standard Deviation (Population) | 7.5% | 5.7% |
Similar Demographics by Unemployment
Demographics Similar to Immigrants from Northern Africa by Unemployment
In terms of unemployment, the demographic groups most similar to Immigrants from Northern Africa are Immigrants from Kazakhstan (5.2%, a difference of 0.070%), Sri Lankan (5.2%, a difference of 0.13%), Immigrants from China (5.2%, a difference of 0.28%), Immigrants from Eastern Europe (5.2%, a difference of 0.32%), and Immigrants from Hong Kong (5.2%, a difference of 0.32%).
| Demographics | Rating | Rank | Unemployment |
| Immigrants | Italy | 79.1 /100 | #148 | Good 5.1% |
| Syrians | 77.7 /100 | #149 | Good 5.2% |
| Potawatomi | 76.2 /100 | #150 | Good 5.2% |
| Immigrants | Eastern Europe | 75.3 /100 | #151 | Good 5.2% |
| Immigrants | Hong Kong | 75.2 /100 | #152 | Good 5.2% |
| Egyptians | 75.2 /100 | #153 | Good 5.2% |
| Immigrants | China | 74.7 /100 | #154 | Good 5.2% |
| Immigrants | Northern Africa | 71.3 /100 | #155 | Good 5.2% |
| Immigrants | Kazakhstan | 70.4 /100 | #156 | Good 5.2% |
| Sri Lankans | 69.5 /100 | #157 | Good 5.2% |
| Immigrants | Egypt | 66.7 /100 | #158 | Good 5.2% |
| Immigrants | Russia | 66.6 /100 | #159 | Good 5.2% |
| Laotians | 66.3 /100 | #160 | Good 5.2% |
| Immigrants | Oceania | 65.2 /100 | #161 | Good 5.2% |
| Spanish | 65.1 /100 | #162 | Good 5.2% |
Demographics Similar to Sub-Saharan Africans by Unemployment
In terms of unemployment, the demographic groups most similar to Sub-Saharan Africans are Immigrants from Uzbekistan (5.8%, a difference of 0.020%), Immigrants from Guatemala (5.8%, a difference of 0.040%), Immigrants from Bahamas (5.8%, a difference of 0.12%), Sierra Leonean (5.8%, a difference of 0.14%), and Salvadoran (5.8%, a difference of 0.17%).
| Demographics | Rating | Rank | Unemployment |
| Hondurans | 0.3 /100 | #252 | Tragic 5.7% |
| Central Americans | 0.3 /100 | #253 | Tragic 5.7% |
| Immigrants | Honduras | 0.3 /100 | #254 | Tragic 5.7% |
| Immigrants | Portugal | 0.2 /100 | #255 | Tragic 5.7% |
| Guatemalans | 0.2 /100 | #256 | Tragic 5.8% |
| Yaqui | 0.2 /100 | #257 | Tragic 5.8% |
| Immigrants | Bahamas | 0.1 /100 | #258 | Tragic 5.8% |
| Sub-Saharan Africans | 0.1 /100 | #259 | Tragic 5.8% |
| Immigrants | Uzbekistan | 0.1 /100 | #260 | Tragic 5.8% |
| Immigrants | Guatemala | 0.1 /100 | #261 | Tragic 5.8% |
| Sierra Leoneans | 0.1 /100 | #262 | Tragic 5.8% |
| Salvadorans | 0.1 /100 | #263 | Tragic 5.8% |
| Immigrants | Liberia | 0.1 /100 | #264 | Tragic 5.8% |
| Nigerians | 0.1 /100 | #265 | Tragic 5.8% |
| Mexican American Indians | 0.1 /100 | #266 | Tragic 5.8% |