Pima vs Spanish American Male Unemployment
COMPARE
Pima
Spanish American
Male Unemployment
Male Unemployment Comparison
Pima
Spanish Americans
8.3%
MALE UNEMPLOYMENT
0.0/ 100
METRIC RATING
332nd/ 347
METRIC RANK
5.7%
MALE UNEMPLOYMENT
0.3/ 100
METRIC RATING
251st/ 347
METRIC RANK
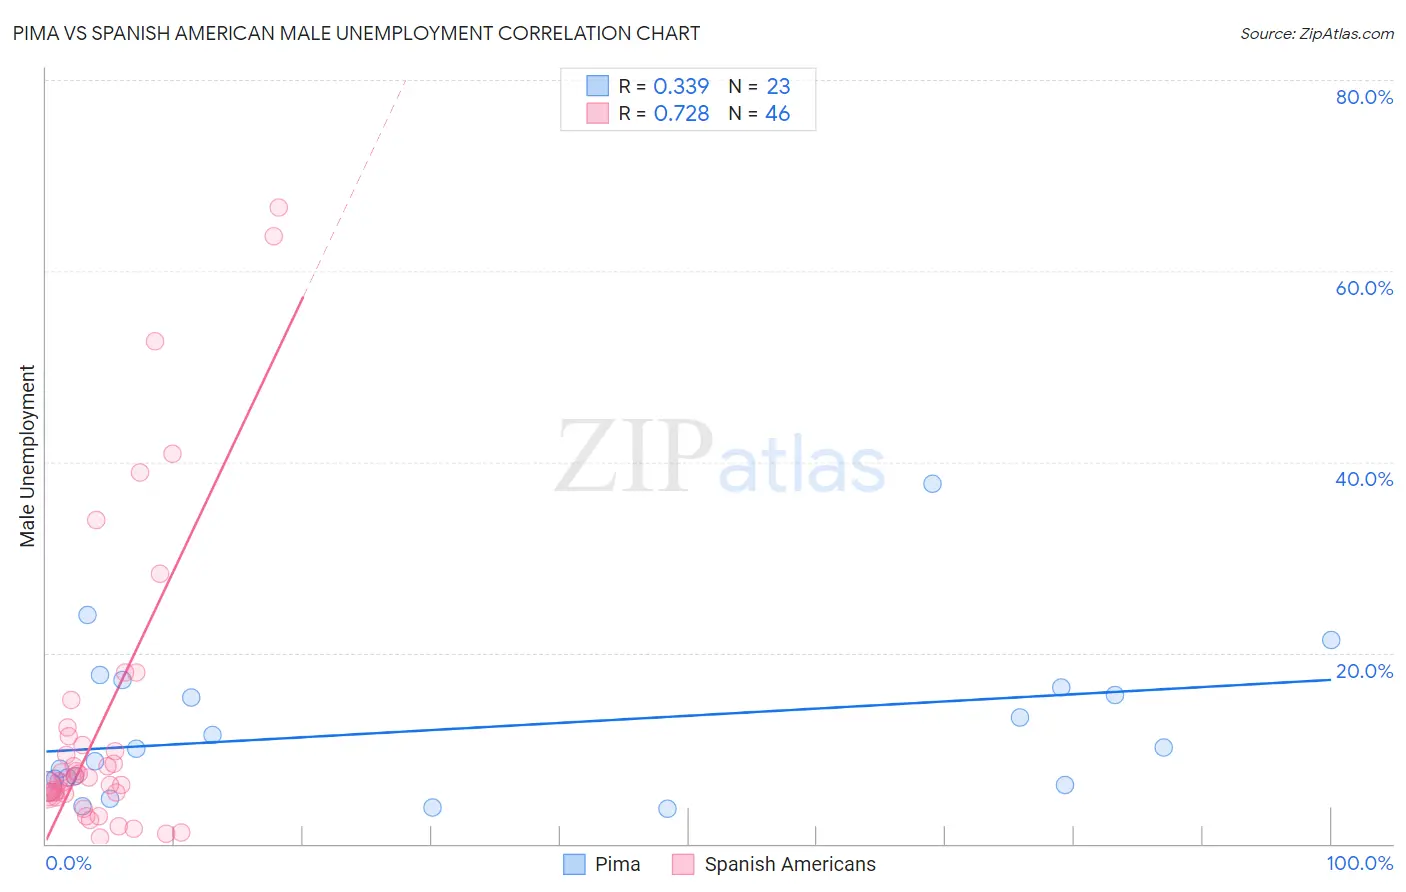
Pima vs Spanish American Male Unemployment Correlation Chart
The statistical analysis conducted on geographies consisting of 61,468,646 people shows a mild positive correlation between the proportion of Pima and unemployment rate among males in the United States with a correlation coefficient (R) of 0.339 and weighted average of 8.3%. Similarly, the statistical analysis conducted on geographies consisting of 103,047,873 people shows a strong positive correlation between the proportion of Spanish Americans and unemployment rate among males in the United States with a correlation coefficient (R) of 0.728 and weighted average of 5.7%, a difference of 44.3%.
Male Unemployment Correlation Summary
| Measurement | Pima | Spanish American |
| Minimum | 3.7% | 0.60% |
| Maximum | 37.7% | 66.7% |
| Range | 34.0% | 66.1% |
| Mean | 12.0% | 12.8% |
| Median | 10.0% | 6.7% |
| Interquartile 25% (IQ1) | 6.2% | 5.2% |
| Interquartile 75% (IQ3) | 16.4% | 11.3% |
| Interquartile Range (IQR) | 10.2% | 6.1% |
| Standard Deviation (Sample) | 8.1% | 15.8% |
| Standard Deviation (Population) | 7.9% | 15.7% |
Similar Demographics by Male Unemployment
Demographics Similar to Pima by Male Unemployment
In terms of male unemployment, the demographic groups most similar to Pima are Sioux (8.4%, a difference of 1.3%), Tsimshian (8.5%, a difference of 2.3%), Alaska Native (8.1%, a difference of 2.4%), Pueblo (8.5%, a difference of 2.4%), and Yuman (8.6%, a difference of 3.8%).
| Demographics | Rating | Rank | Male Unemployment |
| Shoshone | 0.0 /100 | #325 | Tragic 7.6% |
| Immigrants | Dominican Republic | 0.0 /100 | #326 | Tragic 7.6% |
| Paiute | 0.0 /100 | #327 | Tragic 7.7% |
| Natives/Alaskans | 0.0 /100 | #328 | Tragic 7.7% |
| Immigrants | Yemen | 0.0 /100 | #329 | Tragic 7.8% |
| Yakama | 0.0 /100 | #330 | Tragic 7.9% |
| Alaska Natives | 0.0 /100 | #331 | Tragic 8.1% |
| Pima | 0.0 /100 | #332 | Tragic 8.3% |
| Sioux | 0.0 /100 | #333 | Tragic 8.4% |
| Tsimshian | 0.0 /100 | #334 | Tragic 8.5% |
| Pueblo | 0.0 /100 | #335 | Tragic 8.5% |
| Yuman | 0.0 /100 | #336 | Tragic 8.6% |
| Puerto Ricans | 0.0 /100 | #337 | Tragic 8.6% |
| Apache | 0.0 /100 | #338 | Tragic 8.6% |
| Cheyenne | 0.0 /100 | #339 | Tragic 9.8% |
Demographics Similar to Spanish Americans by Male Unemployment
In terms of male unemployment, the demographic groups most similar to Spanish Americans are Immigrants from Bahamas (5.7%, a difference of 0.040%), Cree (5.7%, a difference of 0.29%), Marshallese (5.7%, a difference of 0.36%), Mexican (5.8%, a difference of 0.57%), and Hawaiian (5.7%, a difference of 0.68%).
| Demographics | Rating | Rank | Male Unemployment |
| Immigrants | El Salvador | 0.7 /100 | #244 | Tragic 5.7% |
| Yaqui | 0.7 /100 | #245 | Tragic 5.7% |
| Iroquois | 0.6 /100 | #246 | Tragic 5.7% |
| Hawaiians | 0.6 /100 | #247 | Tragic 5.7% |
| Marshallese | 0.5 /100 | #248 | Tragic 5.7% |
| Cree | 0.4 /100 | #249 | Tragic 5.7% |
| Immigrants | Bahamas | 0.4 /100 | #250 | Tragic 5.7% |
| Spanish Americans | 0.3 /100 | #251 | Tragic 5.7% |
| Mexicans | 0.2 /100 | #252 | Tragic 5.8% |
| Mexican American Indians | 0.2 /100 | #253 | Tragic 5.8% |
| Japanese | 0.2 /100 | #254 | Tragic 5.8% |
| Kiowa | 0.2 /100 | #255 | Tragic 5.8% |
| Comanche | 0.2 /100 | #256 | Tragic 5.8% |
| Hispanics or Latinos | 0.1 /100 | #257 | Tragic 5.8% |
| Dutch West Indians | 0.1 /100 | #258 | Tragic 5.8% |