Pima vs Dutch Unemployment Among Women with Children Ages 6 to 17 years
COMPARE
Pima
Dutch
Unemployment Among Women with Children Ages 6 to 17 years
Unemployment Among Women with Children Ages 6 to 17 years Comparison
Pima
Dutch
18.9%
UNEMPLOYMENT AMONG WOMEN WITH CHILDREN AGES 6 TO 17 YEARS
0.0/ 100
METRIC RATING
347th/ 347
METRIC RANK
9.4%
UNEMPLOYMENT AMONG WOMEN WITH CHILDREN AGES 6 TO 17 YEARS
1.5/ 100
METRIC RATING
248th/ 347
METRIC RANK
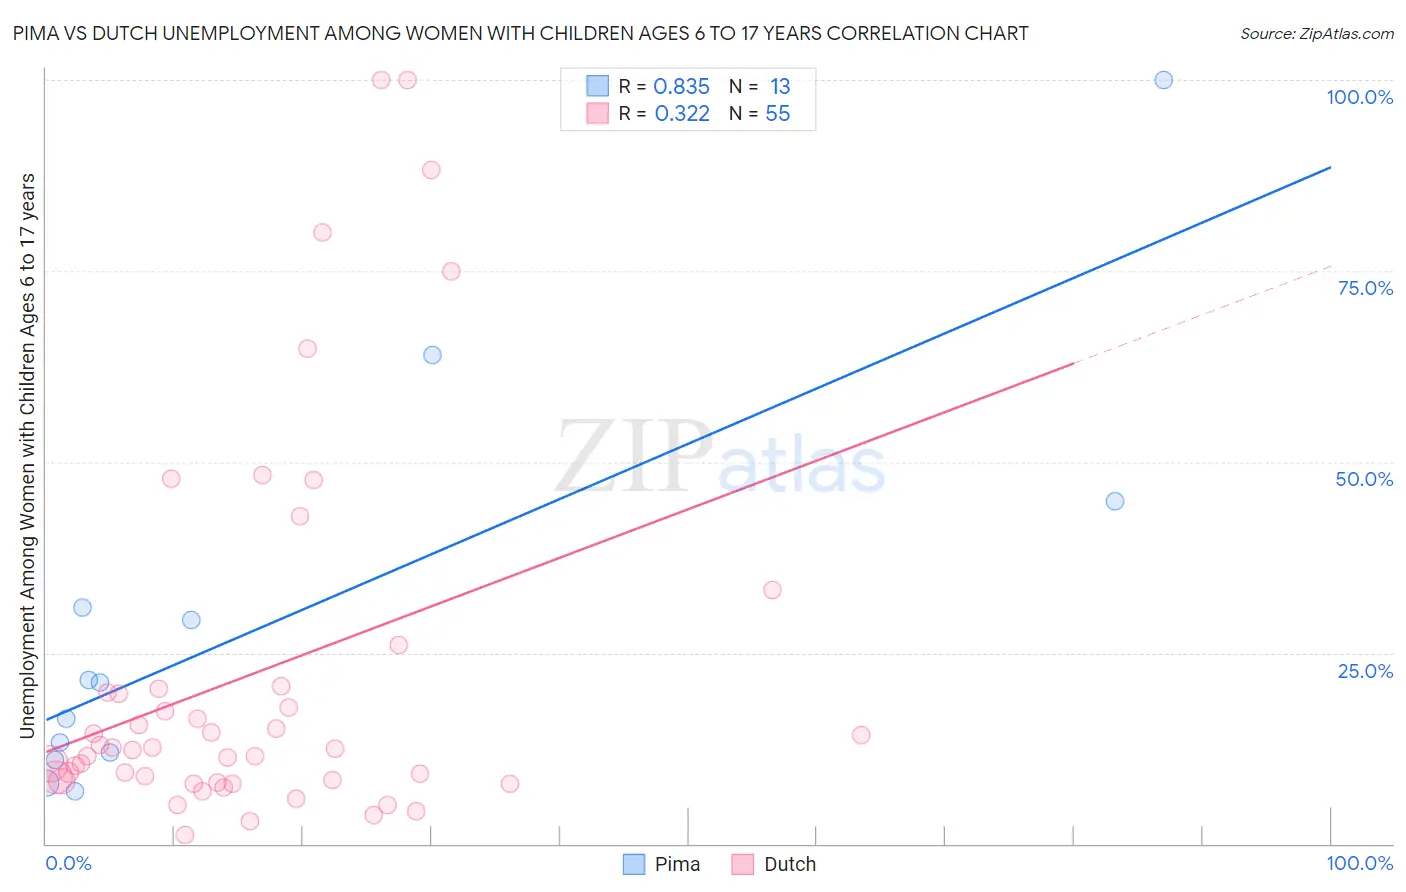
Pima vs Dutch Unemployment Among Women with Children Ages 6 to 17 years Correlation Chart
The statistical analysis conducted on geographies consisting of 57,470,854 people shows a very strong positive correlation between the proportion of Pima and unemployment rate among women with children between the ages 6 and 17 in the United States with a correlation coefficient (R) of 0.835 and weighted average of 18.9%. Similarly, the statistical analysis conducted on geographies consisting of 349,724,133 people shows a mild positive correlation between the proportion of Dutch and unemployment rate among women with children between the ages 6 and 17 in the United States with a correlation coefficient (R) of 0.322 and weighted average of 9.4%, a difference of 101.2%.
Unemployment Among Women with Children Ages 6 to 17 years Correlation Summary
| Measurement | Pima | Dutch |
| Minimum | 6.8% | 1.2% |
| Maximum | 100.0% | 100.0% |
| Range | 93.2% | 98.8% |
| Mean | 29.2% | 22.3% |
| Median | 21.2% | 12.4% |
| Interquartile 25% (IQ1) | 11.5% | 8.1% |
| Interquartile 75% (IQ3) | 37.9% | 20.2% |
| Interquartile Range (IQR) | 26.4% | 12.1% |
| Standard Deviation (Sample) | 26.8% | 24.9% |
| Standard Deviation (Population) | 25.7% | 24.6% |
Similar Demographics by Unemployment Among Women with Children Ages 6 to 17 years
Demographics Similar to Pima by Unemployment Among Women with Children Ages 6 to 17 years
In terms of unemployment among women with children ages 6 to 17 years, the demographic groups most similar to Pima are Yup'ik (18.6%, a difference of 1.4%), Arapaho (16.8%, a difference of 12.0%), Cheyenne (16.4%, a difference of 15.2%), Inupiat (14.9%, a difference of 27.1%), and Yuman (14.8%, a difference of 27.5%).
| Demographics | Rating | Rank | Unemployment Among Women with Children Ages 6 to 17 years |
| Natives/Alaskans | 0.0 /100 | #333 | Tragic 11.5% |
| Ugandans | 0.0 /100 | #334 | Tragic 12.0% |
| Colville | 0.0 /100 | #335 | Tragic 12.3% |
| Houma | 0.0 /100 | #336 | Tragic 12.5% |
| Immigrants | Yemen | 0.0 /100 | #337 | Tragic 12.7% |
| Hopi | 0.0 /100 | #338 | Tragic 12.9% |
| Sioux | 0.0 /100 | #339 | Tragic 13.2% |
| Puerto Ricans | 0.0 /100 | #340 | Tragic 13.9% |
| Navajo | 0.0 /100 | #341 | Tragic 14.2% |
| Yuman | 0.0 /100 | #342 | Tragic 14.8% |
| Inupiat | 0.0 /100 | #343 | Tragic 14.9% |
| Cheyenne | 0.0 /100 | #344 | Tragic 16.4% |
| Arapaho | 0.0 /100 | #345 | Tragic 16.8% |
| Yup'ik | 0.0 /100 | #346 | Tragic 18.6% |
| Pima | 0.0 /100 | #347 | Tragic 18.9% |
Demographics Similar to Dutch by Unemployment Among Women with Children Ages 6 to 17 years
In terms of unemployment among women with children ages 6 to 17 years, the demographic groups most similar to Dutch are Immigrants from South America (9.4%, a difference of 0.010%), Polish (9.4%, a difference of 0.040%), Immigrants from Africa (9.4%, a difference of 0.070%), Immigrants from Guatemala (9.4%, a difference of 0.10%), and Central American (9.4%, a difference of 0.11%).
| Demographics | Rating | Rank | Unemployment Among Women with Children Ages 6 to 17 years |
| Colombians | 2.2 /100 | #241 | Tragic 9.3% |
| Immigrants | Colombia | 2.1 /100 | #242 | Tragic 9.3% |
| Scottish | 2.0 /100 | #243 | Tragic 9.4% |
| English | 1.9 /100 | #244 | Tragic 9.4% |
| Immigrants | Cameroon | 1.8 /100 | #245 | Tragic 9.4% |
| Immigrants | Africa | 1.6 /100 | #246 | Tragic 9.4% |
| Poles | 1.5 /100 | #247 | Tragic 9.4% |
| Dutch | 1.5 /100 | #248 | Tragic 9.4% |
| Immigrants | South America | 1.5 /100 | #249 | Tragic 9.4% |
| Immigrants | Guatemala | 1.3 /100 | #250 | Tragic 9.4% |
| Central Americans | 1.3 /100 | #251 | Tragic 9.4% |
| Creek | 1.2 /100 | #252 | Tragic 9.4% |
| Portuguese | 1.1 /100 | #253 | Tragic 9.4% |
| Nicaraguans | 1.0 /100 | #254 | Tragic 9.4% |
| Lithuanians | 0.9 /100 | #255 | Tragic 9.4% |