Yup'ik vs Immigrants from Latvia Male Unemployment
COMPARE
Yup'ik
Immigrants from Latvia
Male Unemployment
Male Unemployment Comparison
Yup'ik
Immigrants from Latvia
16.4%
MALE UNEMPLOYMENT
0.0/ 100
METRIC RATING
347th/ 347
METRIC RANK
5.1%
MALE UNEMPLOYMENT
87.5/ 100
METRIC RATING
124th/ 347
METRIC RANK
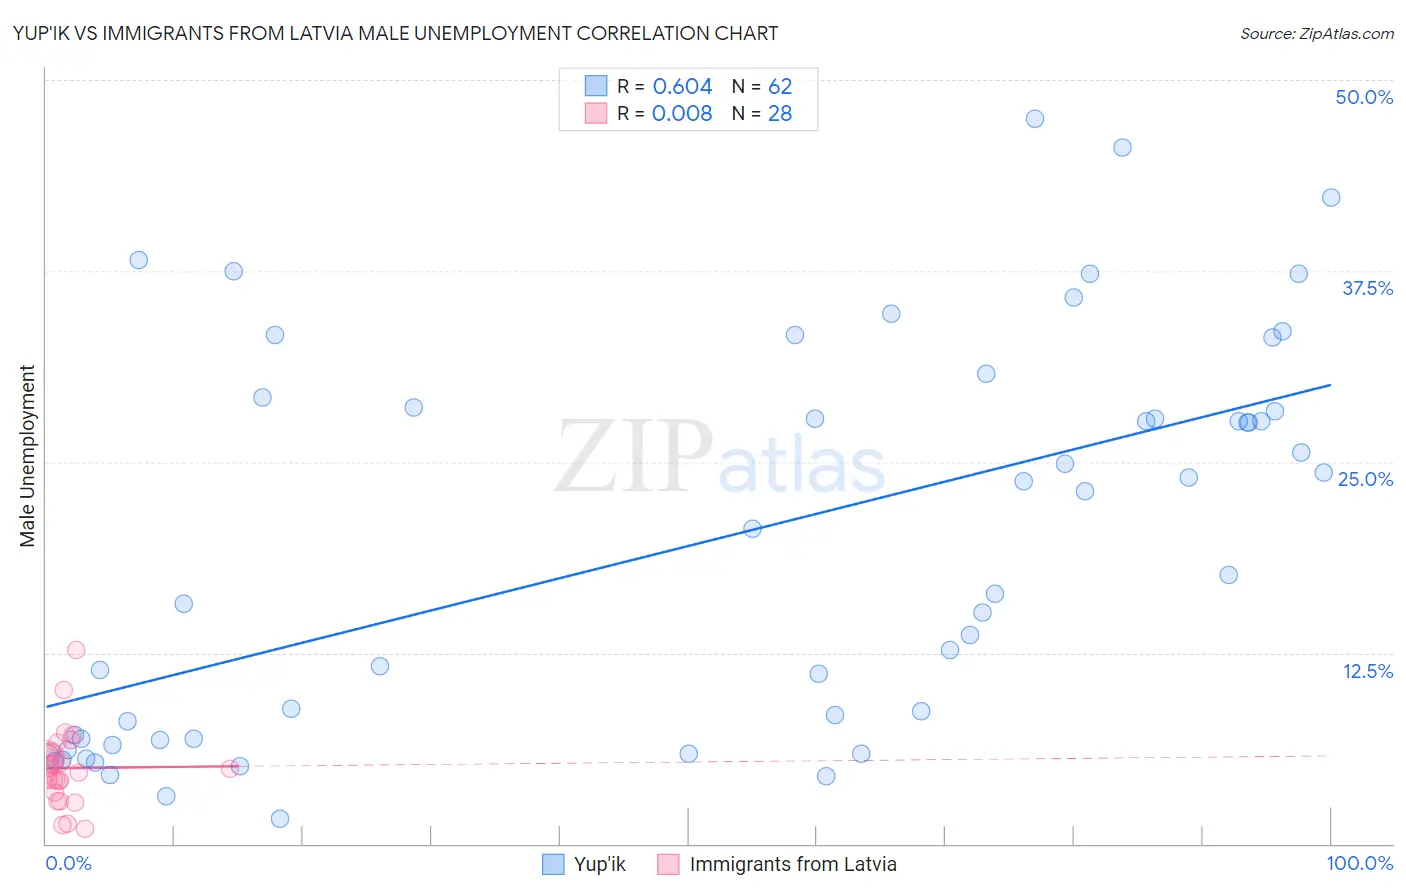
Yup'ik vs Immigrants from Latvia Male Unemployment Correlation Chart
The statistical analysis conducted on geographies consisting of 39,936,758 people shows a significant positive correlation between the proportion of Yup'ik and unemployment rate among males in the United States with a correlation coefficient (R) of 0.604 and weighted average of 16.4%. Similarly, the statistical analysis conducted on geographies consisting of 113,659,649 people shows no correlation between the proportion of Immigrants from Latvia and unemployment rate among males in the United States with a correlation coefficient (R) of 0.008 and weighted average of 5.1%, a difference of 219.5%.
Male Unemployment Correlation Summary
| Measurement | Yup'ik | Immigrants from Latvia |
| Minimum | 1.6% | 1.0% |
| Maximum | 47.5% | 12.7% |
| Range | 45.9% | 11.7% |
| Mean | 19.7% | 5.0% |
| Median | 19.1% | 4.8% |
| Interquartile 25% (IQ1) | 6.9% | 3.7% |
| Interquartile 75% (IQ3) | 28.6% | 6.0% |
| Interquartile Range (IQR) | 21.7% | 2.3% |
| Standard Deviation (Sample) | 12.8% | 2.5% |
| Standard Deviation (Population) | 12.7% | 2.5% |
Similar Demographics by Male Unemployment
Demographics Similar to Yup'ik by Male Unemployment
In terms of male unemployment, the demographic groups most similar to Yup'ik are Inupiat (12.1%, a difference of 36.1%), Arapaho (11.0%, a difference of 49.4%), Hopi (10.8%, a difference of 52.4%), Crow (10.6%, a difference of 54.9%), and Tohono O'odham (10.2%, a difference of 61.7%).
| Demographics | Rating | Rank | Male Unemployment |
| Sioux | 0.0 /100 | #333 | Tragic 8.4% |
| Tsimshian | 0.0 /100 | #334 | Tragic 8.5% |
| Pueblo | 0.0 /100 | #335 | Tragic 8.5% |
| Yuman | 0.0 /100 | #336 | Tragic 8.6% |
| Puerto Ricans | 0.0 /100 | #337 | Tragic 8.6% |
| Apache | 0.0 /100 | #338 | Tragic 8.6% |
| Cheyenne | 0.0 /100 | #339 | Tragic 9.8% |
| Alaskan Athabascans | 0.0 /100 | #340 | Tragic 9.8% |
| Navajo | 0.0 /100 | #341 | Tragic 9.8% |
| Tohono O'odham | 0.0 /100 | #342 | Tragic 10.2% |
| Crow | 0.0 /100 | #343 | Tragic 10.6% |
| Hopi | 0.0 /100 | #344 | Tragic 10.8% |
| Arapaho | 0.0 /100 | #345 | Tragic 11.0% |
| Inupiat | 0.0 /100 | #346 | Tragic 12.1% |
| Yup'ik | 0.0 /100 | #347 | Tragic 16.4% |
Demographics Similar to Immigrants from Latvia by Male Unemployment
In terms of male unemployment, the demographic groups most similar to Immigrants from Latvia are Palestinian (5.1%, a difference of 0.030%), Immigrants from Lithuania (5.1%, a difference of 0.040%), Nicaraguan (5.1%, a difference of 0.10%), Immigrants from Colombia (5.1%, a difference of 0.10%), and Ukrainian (5.1%, a difference of 0.13%).
| Demographics | Rating | Rank | Male Unemployment |
| Estonians | 89.0 /100 | #117 | Excellent 5.1% |
| Cypriots | 88.8 /100 | #118 | Excellent 5.1% |
| French Canadians | 88.6 /100 | #119 | Excellent 5.1% |
| Ukrainians | 88.4 /100 | #120 | Excellent 5.1% |
| Mongolians | 88.4 /100 | #121 | Excellent 5.1% |
| Nicaraguans | 88.2 /100 | #122 | Excellent 5.1% |
| Palestinians | 87.7 /100 | #123 | Excellent 5.1% |
| Immigrants | Latvia | 87.5 /100 | #124 | Excellent 5.1% |
| Immigrants | Lithuania | 87.2 /100 | #125 | Excellent 5.1% |
| Immigrants | Colombia | 86.8 /100 | #126 | Excellent 5.1% |
| Immigrants | Brazil | 86.3 /100 | #127 | Excellent 5.2% |
| Hungarians | 85.1 /100 | #128 | Excellent 5.2% |
| Immigrants | Western Europe | 84.8 /100 | #129 | Excellent 5.2% |
| Immigrants | Malaysia | 83.5 /100 | #130 | Excellent 5.2% |
| Immigrants | Germany | 83.0 /100 | #131 | Excellent 5.2% |