Aleut vs Immigrants from Latvia Male Unemployment
COMPARE
Aleut
Immigrants from Latvia
Male Unemployment
Male Unemployment Comparison
Aleuts
Immigrants from Latvia
6.8%
MALE UNEMPLOYMENT
0.0/ 100
METRIC RATING
308th/ 347
METRIC RANK
5.1%
MALE UNEMPLOYMENT
87.5/ 100
METRIC RATING
124th/ 347
METRIC RANK
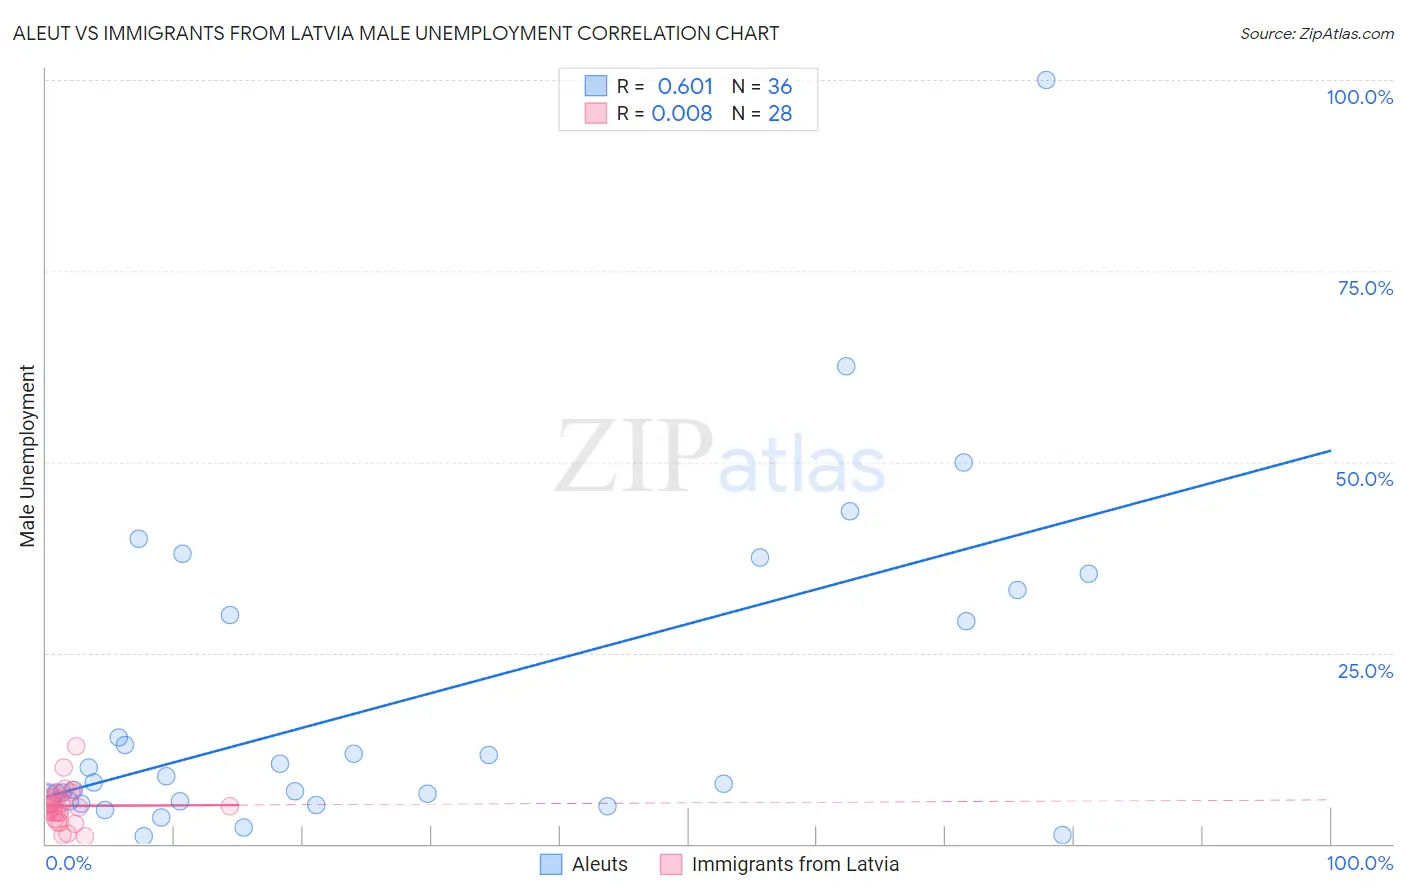
Aleut vs Immigrants from Latvia Male Unemployment Correlation Chart
The statistical analysis conducted on geographies consisting of 61,714,697 people shows a significant positive correlation between the proportion of Aleuts and unemployment rate among males in the United States with a correlation coefficient (R) of 0.601 and weighted average of 6.8%. Similarly, the statistical analysis conducted on geographies consisting of 113,659,649 people shows no correlation between the proportion of Immigrants from Latvia and unemployment rate among males in the United States with a correlation coefficient (R) of 0.008 and weighted average of 5.1%, a difference of 32.7%.
Male Unemployment Correlation Summary
| Measurement | Aleut | Immigrants from Latvia |
| Minimum | 1.0% | 1.0% |
| Maximum | 100.0% | 12.7% |
| Range | 99.0% | 11.7% |
| Mean | 18.7% | 5.0% |
| Median | 8.4% | 4.8% |
| Interquartile 25% (IQ1) | 5.6% | 3.7% |
| Interquartile 75% (IQ3) | 31.7% | 6.0% |
| Interquartile Range (IQR) | 26.1% | 2.3% |
| Standard Deviation (Sample) | 21.2% | 2.5% |
| Standard Deviation (Population) | 20.9% | 2.5% |
Similar Demographics by Male Unemployment
Demographics Similar to Aleuts by Male Unemployment
In terms of male unemployment, the demographic groups most similar to Aleuts are Barbadian (6.9%, a difference of 0.41%), Black/African American (6.9%, a difference of 1.1%), Immigrants from Armenia (6.9%, a difference of 1.4%), Lumbee (6.9%, a difference of 1.6%), and Immigrants from Jamaica (6.7%, a difference of 1.9%).
| Demographics | Rating | Rank | Male Unemployment |
| Immigrants | Belize | 0.0 /100 | #301 | Tragic 6.6% |
| Ute | 0.0 /100 | #302 | Tragic 6.6% |
| Immigrants | West Indies | 0.0 /100 | #303 | Tragic 6.7% |
| West Indians | 0.0 /100 | #304 | Tragic 6.7% |
| Trinidadians and Tobagonians | 0.0 /100 | #305 | Tragic 6.7% |
| Immigrants | Trinidad and Tobago | 0.0 /100 | #306 | Tragic 6.7% |
| Immigrants | Jamaica | 0.0 /100 | #307 | Tragic 6.7% |
| Aleuts | 0.0 /100 | #308 | Tragic 6.8% |
| Barbadians | 0.0 /100 | #309 | Tragic 6.9% |
| Blacks/African Americans | 0.0 /100 | #310 | Tragic 6.9% |
| Immigrants | Armenia | 0.0 /100 | #311 | Tragic 6.9% |
| Lumbee | 0.0 /100 | #312 | Tragic 6.9% |
| Immigrants | Dominica | 0.0 /100 | #313 | Tragic 7.0% |
| Immigrants | Barbados | 0.0 /100 | #314 | Tragic 7.1% |
| Houma | 0.0 /100 | #315 | Tragic 7.1% |
Demographics Similar to Immigrants from Latvia by Male Unemployment
In terms of male unemployment, the demographic groups most similar to Immigrants from Latvia are Palestinian (5.1%, a difference of 0.030%), Immigrants from Lithuania (5.1%, a difference of 0.040%), Nicaraguan (5.1%, a difference of 0.10%), Immigrants from Colombia (5.1%, a difference of 0.10%), and Ukrainian (5.1%, a difference of 0.13%).
| Demographics | Rating | Rank | Male Unemployment |
| Estonians | 89.0 /100 | #117 | Excellent 5.1% |
| Cypriots | 88.8 /100 | #118 | Excellent 5.1% |
| French Canadians | 88.6 /100 | #119 | Excellent 5.1% |
| Ukrainians | 88.4 /100 | #120 | Excellent 5.1% |
| Mongolians | 88.4 /100 | #121 | Excellent 5.1% |
| Nicaraguans | 88.2 /100 | #122 | Excellent 5.1% |
| Palestinians | 87.7 /100 | #123 | Excellent 5.1% |
| Immigrants | Latvia | 87.5 /100 | #124 | Excellent 5.1% |
| Immigrants | Lithuania | 87.2 /100 | #125 | Excellent 5.1% |
| Immigrants | Colombia | 86.8 /100 | #126 | Excellent 5.1% |
| Immigrants | Brazil | 86.3 /100 | #127 | Excellent 5.2% |
| Hungarians | 85.1 /100 | #128 | Excellent 5.2% |
| Immigrants | Western Europe | 84.8 /100 | #129 | Excellent 5.2% |
| Immigrants | Malaysia | 83.5 /100 | #130 | Excellent 5.2% |
| Immigrants | Germany | 83.0 /100 | #131 | Excellent 5.2% |