Peruvian vs Immigrants from Turkey Male Unemployment
COMPARE
Peruvian
Immigrants from Turkey
Male Unemployment
Male Unemployment Comparison
Peruvians
Immigrants from Turkey
5.3%
MALE UNEMPLOYMENT
51.9/ 100
METRIC RATING
171st/ 347
METRIC RANK
5.1%
MALE UNEMPLOYMENT
94.4/ 100
METRIC RATING
91st/ 347
METRIC RANK
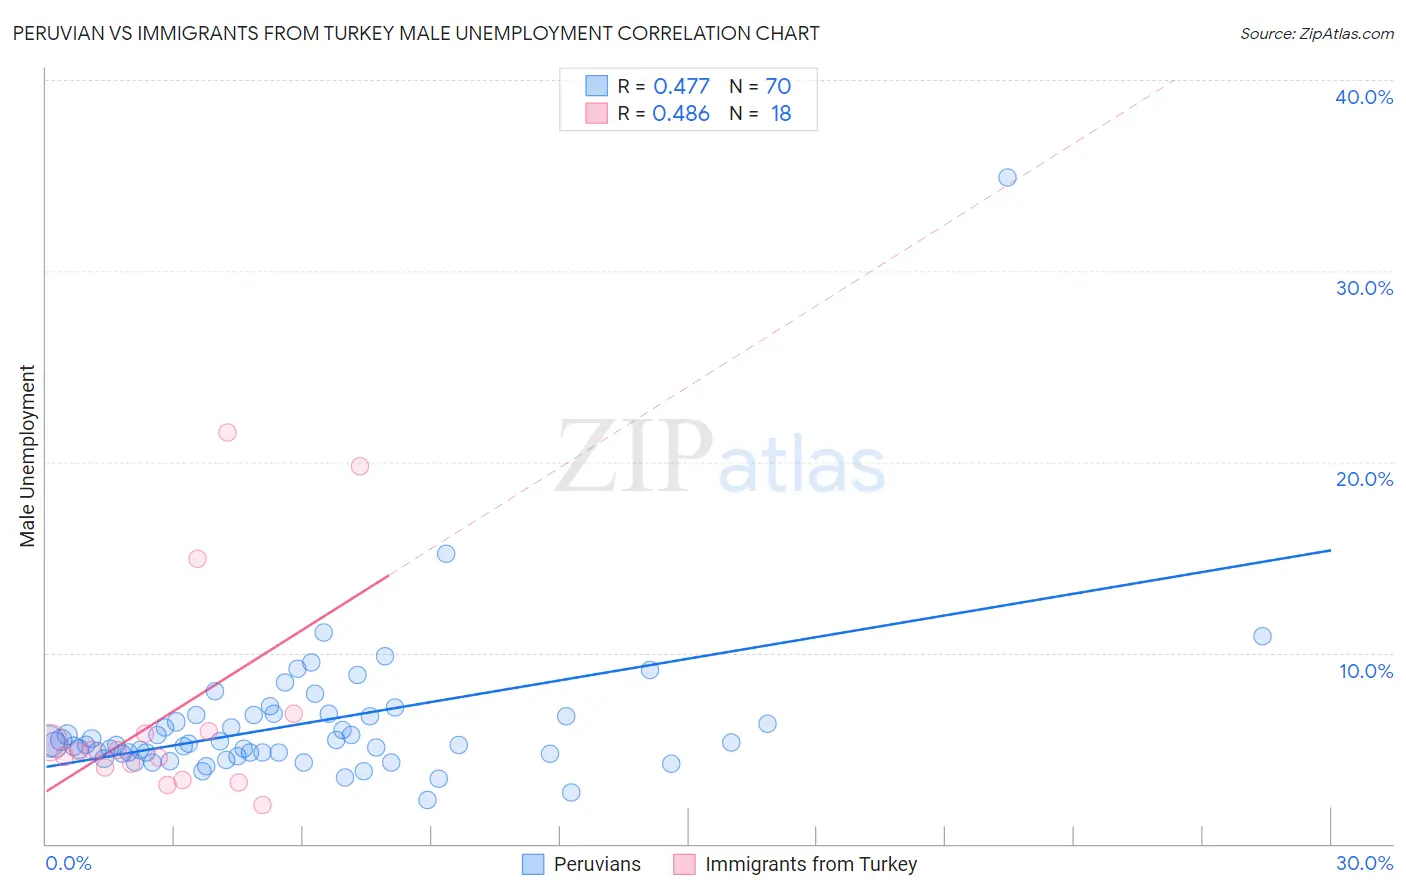
Peruvian vs Immigrants from Turkey Male Unemployment Correlation Chart
The statistical analysis conducted on geographies consisting of 362,248,150 people shows a moderate positive correlation between the proportion of Peruvians and unemployment rate among males in the United States with a correlation coefficient (R) of 0.477 and weighted average of 5.3%. Similarly, the statistical analysis conducted on geographies consisting of 222,708,135 people shows a moderate positive correlation between the proportion of Immigrants from Turkey and unemployment rate among males in the United States with a correlation coefficient (R) of 0.486 and weighted average of 5.1%, a difference of 4.2%.
Male Unemployment Correlation Summary
| Measurement | Peruvian | Immigrants from Turkey |
| Minimum | 2.3% | 2.0% |
| Maximum | 34.9% | 21.5% |
| Range | 32.6% | 19.5% |
| Mean | 6.3% | 6.9% |
| Median | 5.2% | 4.9% |
| Interquartile 25% (IQ1) | 4.7% | 4.0% |
| Interquartile 75% (IQ3) | 6.7% | 5.9% |
| Interquartile Range (IQR) | 2.0% | 1.9% |
| Standard Deviation (Sample) | 4.1% | 5.7% |
| Standard Deviation (Population) | 4.0% | 5.5% |
Similar Demographics by Male Unemployment
Demographics Similar to Peruvians by Male Unemployment
In terms of male unemployment, the demographic groups most similar to Peruvians are Immigrants from Kazakhstan (5.3%, a difference of 0.060%), Immigrants from Russia (5.3%, a difference of 0.070%), Immigrants from Iran (5.3%, a difference of 0.11%), Immigrants from Eastern Europe (5.3%, a difference of 0.13%), and Immigrants from Iraq (5.3%, a difference of 0.22%).
| Demographics | Rating | Rank | Male Unemployment |
| Afghans | 62.0 /100 | #164 | Good 5.3% |
| South Americans | 60.6 /100 | #165 | Good 5.3% |
| Immigrants | Morocco | 60.2 /100 | #166 | Good 5.3% |
| Immigrants | Vietnam | 58.1 /100 | #167 | Average 5.3% |
| Immigrants | Ireland | 57.7 /100 | #168 | Average 5.3% |
| Immigrants | Congo | 57.4 /100 | #169 | Average 5.3% |
| Immigrants | Eastern Europe | 54.1 /100 | #170 | Average 5.3% |
| Peruvians | 51.9 /100 | #171 | Average 5.3% |
| Immigrants | Kazakhstan | 50.8 /100 | #172 | Average 5.3% |
| Immigrants | Russia | 50.7 /100 | #173 | Average 5.3% |
| Immigrants | Iran | 50.0 /100 | #174 | Average 5.3% |
| Immigrants | Iraq | 48.1 /100 | #175 | Average 5.3% |
| Immigrants | Poland | 46.0 /100 | #176 | Average 5.3% |
| Immigrants | Peru | 44.6 /100 | #177 | Average 5.3% |
| Osage | 42.5 /100 | #178 | Average 5.3% |
Demographics Similar to Immigrants from Turkey by Male Unemployment
In terms of male unemployment, the demographic groups most similar to Immigrants from Turkey are Slavic (5.1%, a difference of 0.060%), Immigrants from Serbia (5.1%, a difference of 0.060%), Okinawan (5.1%, a difference of 0.080%), Immigrants from Australia (5.1%, a difference of 0.090%), and Canadian (5.1%, a difference of 0.10%).
| Demographics | Rating | Rank | Male Unemployment |
| Serbians | 95.7 /100 | #84 | Exceptional 5.1% |
| Immigrants | North Macedonia | 95.6 /100 | #85 | Exceptional 5.1% |
| Maltese | 95.5 /100 | #86 | Exceptional 5.1% |
| Immigrants | Romania | 95.4 /100 | #87 | Exceptional 5.1% |
| Immigrants | Sri Lanka | 94.9 /100 | #88 | Exceptional 5.1% |
| Immigrants | Australia | 94.7 /100 | #89 | Exceptional 5.1% |
| Okinawans | 94.7 /100 | #90 | Exceptional 5.1% |
| Immigrants | Turkey | 94.4 /100 | #91 | Exceptional 5.1% |
| Slavs | 94.2 /100 | #92 | Exceptional 5.1% |
| Immigrants | Serbia | 94.2 /100 | #93 | Exceptional 5.1% |
| Canadians | 94.1 /100 | #94 | Exceptional 5.1% |
| Italians | 93.8 /100 | #95 | Exceptional 5.1% |
| Asians | 93.7 /100 | #96 | Exceptional 5.1% |
| Immigrants | Spain | 93.4 /100 | #97 | Exceptional 5.1% |
| Immigrants | Kuwait | 93.3 /100 | #98 | Exceptional 5.1% |