Spaniard vs Immigrants from Latvia Male Unemployment
COMPARE
Spaniard
Immigrants from Latvia
Male Unemployment
Male Unemployment Comparison
Spaniards
Immigrants from Latvia
5.3%
MALE UNEMPLOYMENT
35.1/ 100
METRIC RATING
184th/ 347
METRIC RANK
5.1%
MALE UNEMPLOYMENT
87.5/ 100
METRIC RATING
124th/ 347
METRIC RANK
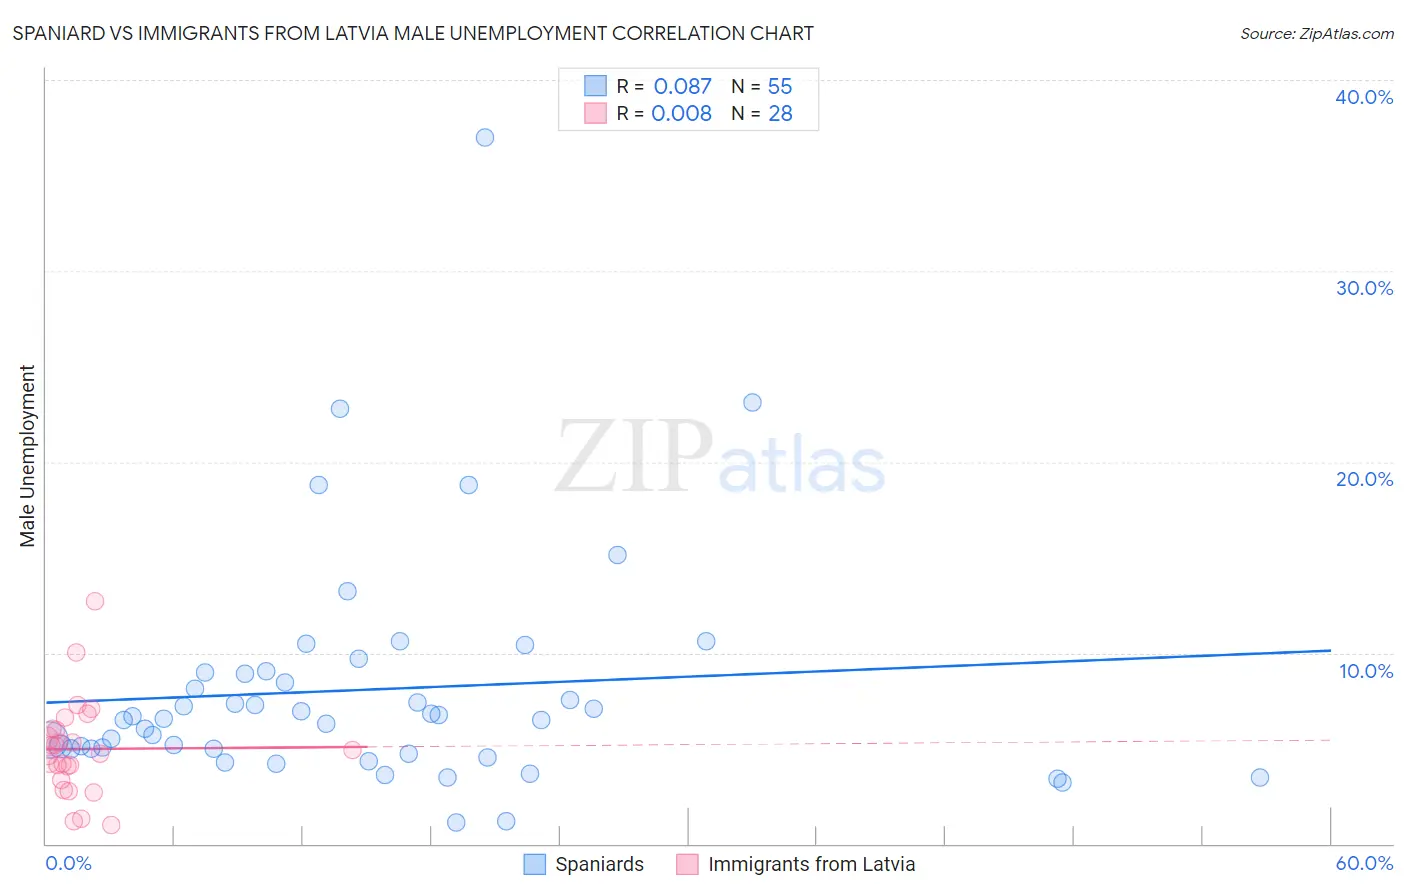
Spaniard vs Immigrants from Latvia Male Unemployment Correlation Chart
The statistical analysis conducted on geographies consisting of 441,055,878 people shows a slight positive correlation between the proportion of Spaniards and unemployment rate among males in the United States with a correlation coefficient (R) of 0.087 and weighted average of 5.3%. Similarly, the statistical analysis conducted on geographies consisting of 113,659,649 people shows no correlation between the proportion of Immigrants from Latvia and unemployment rate among males in the United States with a correlation coefficient (R) of 0.008 and weighted average of 5.1%, a difference of 3.8%.
Male Unemployment Correlation Summary
| Measurement | Spaniard | Immigrants from Latvia |
| Minimum | 1.1% | 1.0% |
| Maximum | 37.0% | 12.7% |
| Range | 35.9% | 11.7% |
| Mean | 8.1% | 5.0% |
| Median | 6.6% | 4.8% |
| Interquartile 25% (IQ1) | 5.0% | 3.7% |
| Interquartile 75% (IQ3) | 8.9% | 6.0% |
| Interquartile Range (IQR) | 4.0% | 2.3% |
| Standard Deviation (Sample) | 6.1% | 2.5% |
| Standard Deviation (Population) | 6.0% | 2.5% |
Similar Demographics by Male Unemployment
Demographics Similar to Spaniards by Male Unemployment
In terms of male unemployment, the demographic groups most similar to Spaniards are Korean (5.3%, a difference of 0.010%), Taiwanese (5.3%, a difference of 0.16%), Potawatomi (5.3%, a difference of 0.17%), Immigrants from Afghanistan (5.3%, a difference of 0.18%), and Iraqi (5.4%, a difference of 0.23%).
| Demographics | Rating | Rank | Male Unemployment |
| Immigrants | Peru | 44.6 /100 | #177 | Average 5.3% |
| Osage | 42.5 /100 | #178 | Average 5.3% |
| Immigrants | Oceania | 40.8 /100 | #179 | Average 5.3% |
| Malaysians | 39.6 /100 | #180 | Fair 5.3% |
| Immigrants | Afghanistan | 37.9 /100 | #181 | Fair 5.3% |
| Potawatomi | 37.8 /100 | #182 | Fair 5.3% |
| Taiwanese | 37.6 /100 | #183 | Fair 5.3% |
| Spaniards | 35.1 /100 | #184 | Fair 5.3% |
| Koreans | 34.9 /100 | #185 | Fair 5.3% |
| Iraqis | 31.6 /100 | #186 | Fair 5.4% |
| Costa Ricans | 31.3 /100 | #187 | Fair 5.4% |
| Arabs | 30.2 /100 | #188 | Fair 5.4% |
| Immigrants | South America | 29.4 /100 | #189 | Fair 5.4% |
| Immigrants | Uganda | 28.8 /100 | #190 | Fair 5.4% |
| Immigrants | South Eastern Asia | 28.2 /100 | #191 | Fair 5.4% |
Demographics Similar to Immigrants from Latvia by Male Unemployment
In terms of male unemployment, the demographic groups most similar to Immigrants from Latvia are Palestinian (5.1%, a difference of 0.030%), Immigrants from Lithuania (5.1%, a difference of 0.040%), Nicaraguan (5.1%, a difference of 0.10%), Immigrants from Colombia (5.1%, a difference of 0.10%), and Ukrainian (5.1%, a difference of 0.13%).
| Demographics | Rating | Rank | Male Unemployment |
| Estonians | 89.0 /100 | #117 | Excellent 5.1% |
| Cypriots | 88.8 /100 | #118 | Excellent 5.1% |
| French Canadians | 88.6 /100 | #119 | Excellent 5.1% |
| Ukrainians | 88.4 /100 | #120 | Excellent 5.1% |
| Mongolians | 88.4 /100 | #121 | Excellent 5.1% |
| Nicaraguans | 88.2 /100 | #122 | Excellent 5.1% |
| Palestinians | 87.7 /100 | #123 | Excellent 5.1% |
| Immigrants | Latvia | 87.5 /100 | #124 | Excellent 5.1% |
| Immigrants | Lithuania | 87.2 /100 | #125 | Excellent 5.1% |
| Immigrants | Colombia | 86.8 /100 | #126 | Excellent 5.1% |
| Immigrants | Brazil | 86.3 /100 | #127 | Excellent 5.2% |
| Hungarians | 85.1 /100 | #128 | Excellent 5.2% |
| Immigrants | Western Europe | 84.8 /100 | #129 | Excellent 5.2% |
| Immigrants | Malaysia | 83.5 /100 | #130 | Excellent 5.2% |
| Immigrants | Germany | 83.0 /100 | #131 | Excellent 5.2% |