Peruvian vs Immigrants from Morocco Unemployment Among Ages 35 to 44 years
COMPARE
Peruvian
Immigrants from Morocco
Unemployment Among Ages 35 to 44 years
Unemployment Among Ages 35 to 44 years Comparison
Peruvians
Immigrants from Morocco
4.7%
UNEMPLOYMENT AMONG AGES 35 TO 44 YEARS
54.4/ 100
METRIC RATING
167th/ 347
METRIC RANK
4.7%
UNEMPLOYMENT AMONG AGES 35 TO 44 YEARS
57.2/ 100
METRIC RATING
164th/ 347
METRIC RANK
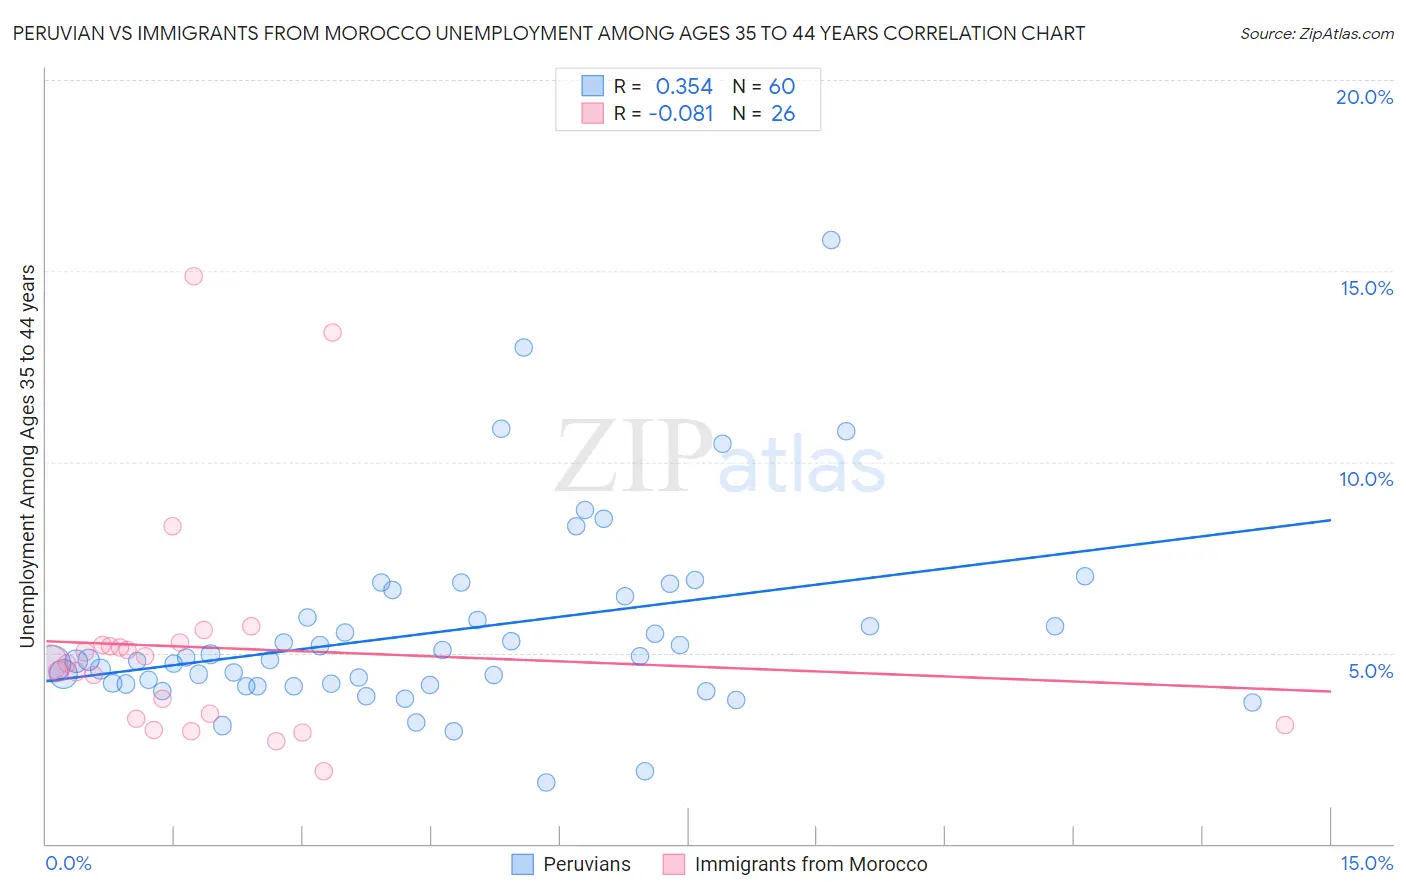
Peruvian vs Immigrants from Morocco Unemployment Among Ages 35 to 44 years Correlation Chart
The statistical analysis conducted on geographies consisting of 357,234,529 people shows a mild positive correlation between the proportion of Peruvians and unemployment rate among population between the ages 35 and 44 in the United States with a correlation coefficient (R) of 0.354 and weighted average of 4.7%. Similarly, the statistical analysis conducted on geographies consisting of 177,996,859 people shows a slight negative correlation between the proportion of Immigrants from Morocco and unemployment rate among population between the ages 35 and 44 in the United States with a correlation coefficient (R) of -0.081 and weighted average of 4.7%, a difference of 0.20%.
Unemployment Among Ages 35 to 44 years Correlation Summary
| Measurement | Peruvian | Immigrants from Morocco |
| Minimum | 1.6% | 1.9% |
| Maximum | 15.8% | 14.9% |
| Range | 14.2% | 13.0% |
| Mean | 5.6% | 5.1% |
| Median | 4.8% | 4.7% |
| Interquartile 25% (IQ1) | 4.2% | 3.3% |
| Interquartile 75% (IQ3) | 6.2% | 5.2% |
| Interquartile Range (IQR) | 2.0% | 1.9% |
| Standard Deviation (Sample) | 2.5% | 3.0% |
| Standard Deviation (Population) | 2.5% | 2.9% |
Demographics Similar to Peruvians and Immigrants from Morocco by Unemployment Among Ages 35 to 44 years
In terms of unemployment among ages 35 to 44 years, the demographic groups most similar to Peruvians are French (4.7%, a difference of 0.090%), Arab (4.7%, a difference of 0.090%), Pennsylvania German (4.7%, a difference of 0.10%), Immigrants from Indonesia (4.7%, a difference of 0.13%), and Indonesian (4.7%, a difference of 0.19%). Similarly, the demographic groups most similar to Immigrants from Morocco are German Russian (4.7%, a difference of 0.0%), South African (4.7%, a difference of 0.090%), French (4.7%, a difference of 0.12%), Costa Rican (4.7%, a difference of 0.18%), and Arab (4.7%, a difference of 0.29%).
| Demographics | Rating | Rank | Unemployment Among Ages 35 to 44 years |
| Whites/Caucasians | 64.9 /100 | #155 | Good 4.6% |
| South Americans | 63.7 /100 | #156 | Good 4.6% |
| Immigrants | Belarus | 63.4 /100 | #157 | Good 4.6% |
| Immigrants | Iran | 63.1 /100 | #158 | Good 4.6% |
| Albanians | 63.0 /100 | #159 | Good 4.6% |
| Hungarians | 62.6 /100 | #160 | Good 4.6% |
| Celtics | 61.7 /100 | #161 | Good 4.7% |
| Costa Ricans | 59.6 /100 | #162 | Average 4.7% |
| South Africans | 58.5 /100 | #163 | Average 4.7% |
| Immigrants | Morocco | 57.2 /100 | #164 | Average 4.7% |
| German Russians | 57.2 /100 | #165 | Average 4.7% |
| French | 55.6 /100 | #166 | Average 4.7% |
| Peruvians | 54.4 /100 | #167 | Average 4.7% |
| Arabs | 53.1 /100 | #168 | Average 4.7% |
| Pennsylvania Germans | 53.0 /100 | #169 | Average 4.7% |
| Immigrants | Indonesia | 52.6 /100 | #170 | Average 4.7% |
| Indonesians | 51.7 /100 | #171 | Average 4.7% |
| Lebanese | 51.4 /100 | #172 | Average 4.7% |
| Iraqis | 50.9 /100 | #173 | Average 4.7% |
| Afghans | 50.0 /100 | #174 | Average 4.7% |
| Immigrants | Germany | 48.9 /100 | #175 | Average 4.7% |