Immigrants from Eritrea vs Ukrainian Female Unemployment
COMPARE
Immigrants from Eritrea
Ukrainian
Female Unemployment
Female Unemployment Comparison
Immigrants from Eritrea
Ukrainians
5.1%
FEMALE UNEMPLOYMENT
84.6/ 100
METRIC RATING
134th/ 347
METRIC RANK
5.0%
FEMALE UNEMPLOYMENT
97.1/ 100
METRIC RATING
85th/ 347
METRIC RANK
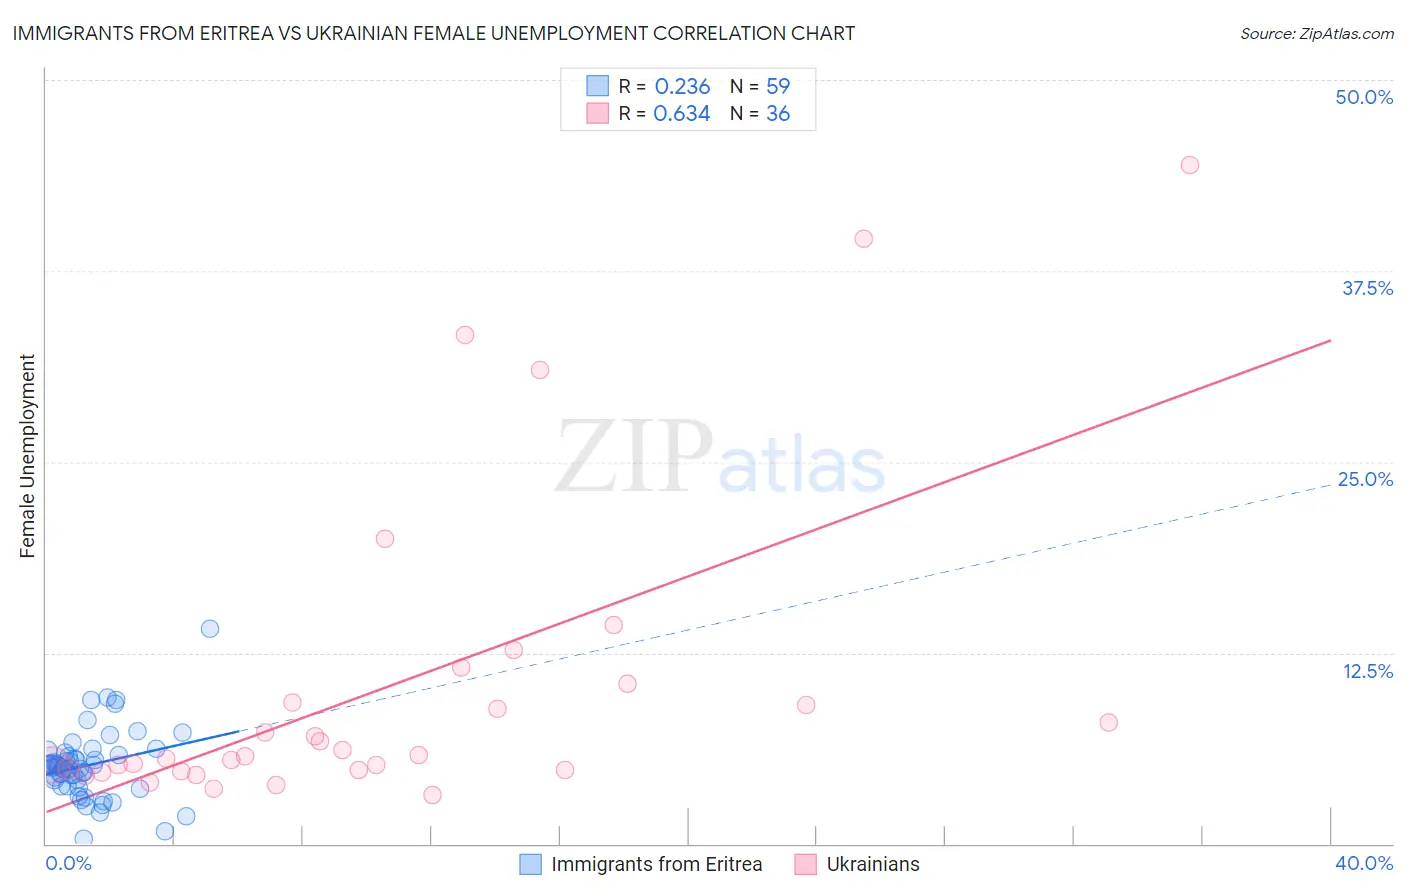
Immigrants from Eritrea vs Ukrainian Female Unemployment Correlation Chart
The statistical analysis conducted on geographies consisting of 104,834,311 people shows a weak positive correlation between the proportion of Immigrants from Eritrea and unemploymnet rate among females in the United States with a correlation coefficient (R) of 0.236 and weighted average of 5.1%. Similarly, the statistical analysis conducted on geographies consisting of 444,684,772 people shows a significant positive correlation between the proportion of Ukrainians and unemploymnet rate among females in the United States with a correlation coefficient (R) of 0.634 and weighted average of 5.0%, a difference of 2.9%.
Female Unemployment Correlation Summary
| Measurement | Immigrants from Eritrea | Ukrainian |
| Minimum | 0.30% | 3.2% |
| Maximum | 14.1% | 44.4% |
| Range | 13.8% | 41.2% |
| Mean | 5.1% | 10.3% |
| Median | 5.1% | 5.8% |
| Interquartile 25% (IQ1) | 3.8% | 4.8% |
| Interquartile 75% (IQ3) | 5.8% | 9.9% |
| Interquartile Range (IQR) | 2.0% | 5.1% |
| Standard Deviation (Sample) | 2.3% | 10.3% |
| Standard Deviation (Population) | 2.2% | 10.2% |
Similar Demographics by Female Unemployment
Demographics Similar to Immigrants from Eritrea by Female Unemployment
In terms of female unemployment, the demographic groups most similar to Immigrants from Eritrea are Immigrants from Latvia (5.1%, a difference of 0.0%), Immigrants from Hong Kong (5.1%, a difference of 0.020%), Immigrants from Sri Lanka (5.1%, a difference of 0.040%), Indian (Asian) (5.1%, a difference of 0.050%), and Immigrants from Ethiopia (5.1%, a difference of 0.090%).
| Demographics | Rating | Rank | Female Unemployment |
| Immigrants | Hungary | 86.0 /100 | #127 | Excellent 5.1% |
| Chileans | 85.8 /100 | #128 | Excellent 5.1% |
| Ethiopians | 85.7 /100 | #129 | Excellent 5.1% |
| Maltese | 85.5 /100 | #130 | Excellent 5.1% |
| Immigrants | Ethiopia | 85.4 /100 | #131 | Excellent 5.1% |
| Immigrants | Sri Lanka | 85.0 /100 | #132 | Excellent 5.1% |
| Immigrants | Hong Kong | 84.8 /100 | #133 | Excellent 5.1% |
| Immigrants | Eritrea | 84.6 /100 | #134 | Excellent 5.1% |
| Immigrants | Latvia | 84.6 /100 | #135 | Excellent 5.1% |
| Indians (Asian) | 84.2 /100 | #136 | Excellent 5.1% |
| Pakistanis | 83.8 /100 | #137 | Excellent 5.1% |
| Chickasaw | 83.2 /100 | #138 | Excellent 5.1% |
| Immigrants | Eastern Asia | 83.0 /100 | #139 | Excellent 5.1% |
| Immigrants | France | 82.7 /100 | #140 | Excellent 5.1% |
| Immigrants | Eastern Europe | 81.5 /100 | #141 | Excellent 5.1% |
Demographics Similar to Ukrainians by Female Unemployment
In terms of female unemployment, the demographic groups most similar to Ukrainians are Bolivian (5.0%, a difference of 0.010%), Canadian (5.0%, a difference of 0.040%), Immigrants from Serbia (5.0%, a difference of 0.080%), Immigrants from Australia (5.0%, a difference of 0.090%), and Venezuelan (5.0%, a difference of 0.10%).
| Demographics | Rating | Rank | Female Unemployment |
| Immigrants | Netherlands | 97.8 /100 | #78 | Exceptional 5.0% |
| Turks | 97.6 /100 | #79 | Exceptional 5.0% |
| New Zealanders | 97.4 /100 | #80 | Exceptional 5.0% |
| Filipinos | 97.3 /100 | #81 | Exceptional 5.0% |
| Immigrants | Australia | 97.3 /100 | #82 | Exceptional 5.0% |
| Immigrants | Serbia | 97.2 /100 | #83 | Exceptional 5.0% |
| Canadians | 97.2 /100 | #84 | Exceptional 5.0% |
| Ukrainians | 97.1 /100 | #85 | Exceptional 5.0% |
| Bolivians | 97.1 /100 | #86 | Exceptional 5.0% |
| Venezuelans | 96.9 /100 | #87 | Exceptional 5.0% |
| Immigrants | Sudan | 96.7 /100 | #88 | Exceptional 5.0% |
| Immigrants | Taiwan | 96.6 /100 | #89 | Exceptional 5.0% |
| Immigrants | Sweden | 96.3 /100 | #90 | Exceptional 5.0% |
| Immigrants | Japan | 96.0 /100 | #91 | Exceptional 5.0% |
| Romanians | 95.9 /100 | #92 | Exceptional 5.0% |