Palestinian vs Ukrainian Unemployment Among Ages 20 to 24 years
COMPARE
Palestinian
Ukrainian
Unemployment Among Ages 20 to 24 years
Unemployment Among Ages 20 to 24 years Comparison
Palestinians
Ukrainians
10.6%
UNEMPLOYMENT AMONG AGES 20 TO 24 YEARS
4.9/ 100
METRIC RATING
227th/ 347
METRIC RANK
10.3%
UNEMPLOYMENT AMONG AGES 20 TO 24 YEARS
50.0/ 100
METRIC RATING
174th/ 347
METRIC RANK
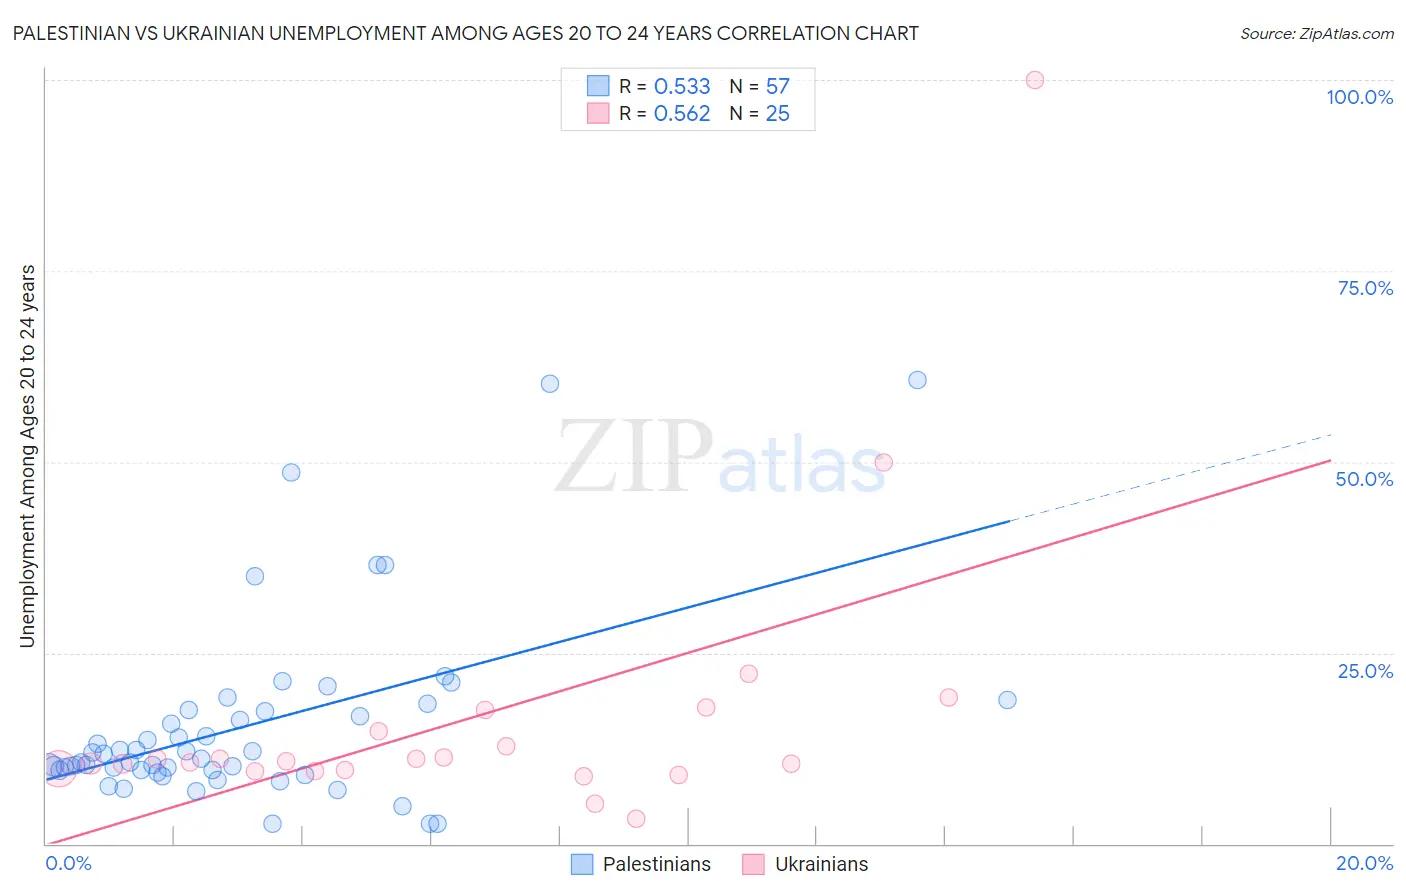
Palestinian vs Ukrainian Unemployment Among Ages 20 to 24 years Correlation Chart
The statistical analysis conducted on geographies consisting of 214,060,905 people shows a substantial positive correlation between the proportion of Palestinians and unemployment rate among population between the ages 20 and 24 in the United States with a correlation coefficient (R) of 0.533 and weighted average of 10.6%. Similarly, the statistical analysis conducted on geographies consisting of 427,946,592 people shows a substantial positive correlation between the proportion of Ukrainians and unemployment rate among population between the ages 20 and 24 in the United States with a correlation coefficient (R) of 0.562 and weighted average of 10.3%, a difference of 2.7%.
Unemployment Among Ages 20 to 24 years Correlation Summary
| Measurement | Palestinian | Ukrainian |
| Minimum | 2.6% | 3.3% |
| Maximum | 60.8% | 100.0% |
| Range | 58.2% | 96.7% |
| Mean | 15.4% | 16.7% |
| Median | 11.1% | 10.8% |
| Interquartile 25% (IQ1) | 9.7% | 9.6% |
| Interquartile 75% (IQ3) | 17.4% | 16.1% |
| Interquartile Range (IQR) | 7.8% | 6.5% |
| Standard Deviation (Sample) | 12.1% | 19.4% |
| Standard Deviation (Population) | 12.0% | 19.0% |
Similar Demographics by Unemployment Among Ages 20 to 24 years
Demographics Similar to Palestinians by Unemployment Among Ages 20 to 24 years
In terms of unemployment among ages 20 to 24 years, the demographic groups most similar to Palestinians are Immigrants from Costa Rica (10.6%, a difference of 0.0%), Immigrants from South America (10.6%, a difference of 0.030%), Nepalese (10.6%, a difference of 0.040%), Mexican American Indian (10.6%, a difference of 0.070%), and American (10.6%, a difference of 0.11%).
| Demographics | Rating | Rank | Unemployment Among Ages 20 to 24 years |
| Eastern Europeans | 6.9 /100 | #220 | Tragic 10.6% |
| Central Americans | 6.8 /100 | #221 | Tragic 10.6% |
| Immigrants | Poland | 6.4 /100 | #222 | Tragic 10.6% |
| Arabs | 5.6 /100 | #223 | Tragic 10.6% |
| Nepalese | 5.1 /100 | #224 | Tragic 10.6% |
| Immigrants | South America | 5.1 /100 | #225 | Tragic 10.6% |
| Immigrants | Costa Rica | 4.9 /100 | #226 | Tragic 10.6% |
| Palestinians | 4.9 /100 | #227 | Tragic 10.6% |
| Mexican American Indians | 4.6 /100 | #228 | Tragic 10.6% |
| Americans | 4.4 /100 | #229 | Tragic 10.6% |
| French American Indians | 4.1 /100 | #230 | Tragic 10.6% |
| Native Hawaiians | 3.9 /100 | #231 | Tragic 10.6% |
| Israelis | 3.7 /100 | #232 | Tragic 10.6% |
| Choctaw | 3.6 /100 | #233 | Tragic 10.6% |
| Immigrants | Africa | 3.5 /100 | #234 | Tragic 10.6% |
Demographics Similar to Ukrainians by Unemployment Among Ages 20 to 24 years
In terms of unemployment among ages 20 to 24 years, the demographic groups most similar to Ukrainians are Immigrants from Sweden (10.3%, a difference of 0.030%), Korean (10.3%, a difference of 0.070%), Immigrants from Eastern Asia (10.3%, a difference of 0.10%), Samoan (10.3%, a difference of 0.17%), and Turkish (10.3%, a difference of 0.19%).
| Demographics | Rating | Rank | Unemployment Among Ages 20 to 24 years |
| Immigrants | Fiji | 57.6 /100 | #167 | Average 10.3% |
| Iraqis | 56.7 /100 | #168 | Average 10.3% |
| Immigrants | Colombia | 56.3 /100 | #169 | Average 10.3% |
| Turks | 55.2 /100 | #170 | Average 10.3% |
| Immigrants | Eastern Asia | 52.7 /100 | #171 | Average 10.3% |
| Koreans | 51.9 /100 | #172 | Average 10.3% |
| Immigrants | Sweden | 50.8 /100 | #173 | Average 10.3% |
| Ukrainians | 50.0 /100 | #174 | Average 10.3% |
| Samoans | 45.4 /100 | #175 | Average 10.3% |
| Potawatomi | 42.0 /100 | #176 | Average 10.3% |
| Immigrants | Czechoslovakia | 40.8 /100 | #177 | Average 10.3% |
| Alsatians | 40.5 /100 | #178 | Average 10.3% |
| Tlingit-Haida | 39.7 /100 | #179 | Fair 10.3% |
| Immigrants | Turkey | 39.3 /100 | #180 | Fair 10.3% |
| Okinawans | 39.1 /100 | #181 | Fair 10.3% |