Cheyenne vs Dominican Female Unemployment
COMPARE
Cheyenne
Dominican
Female Unemployment
Female Unemployment Comparison
Cheyenne
Dominicans
6.6%
FEMALE UNEMPLOYMENT
0.0/ 100
METRIC RATING
324th/ 347
METRIC RANK
7.2%
FEMALE UNEMPLOYMENT
0.0/ 100
METRIC RATING
335th/ 347
METRIC RANK
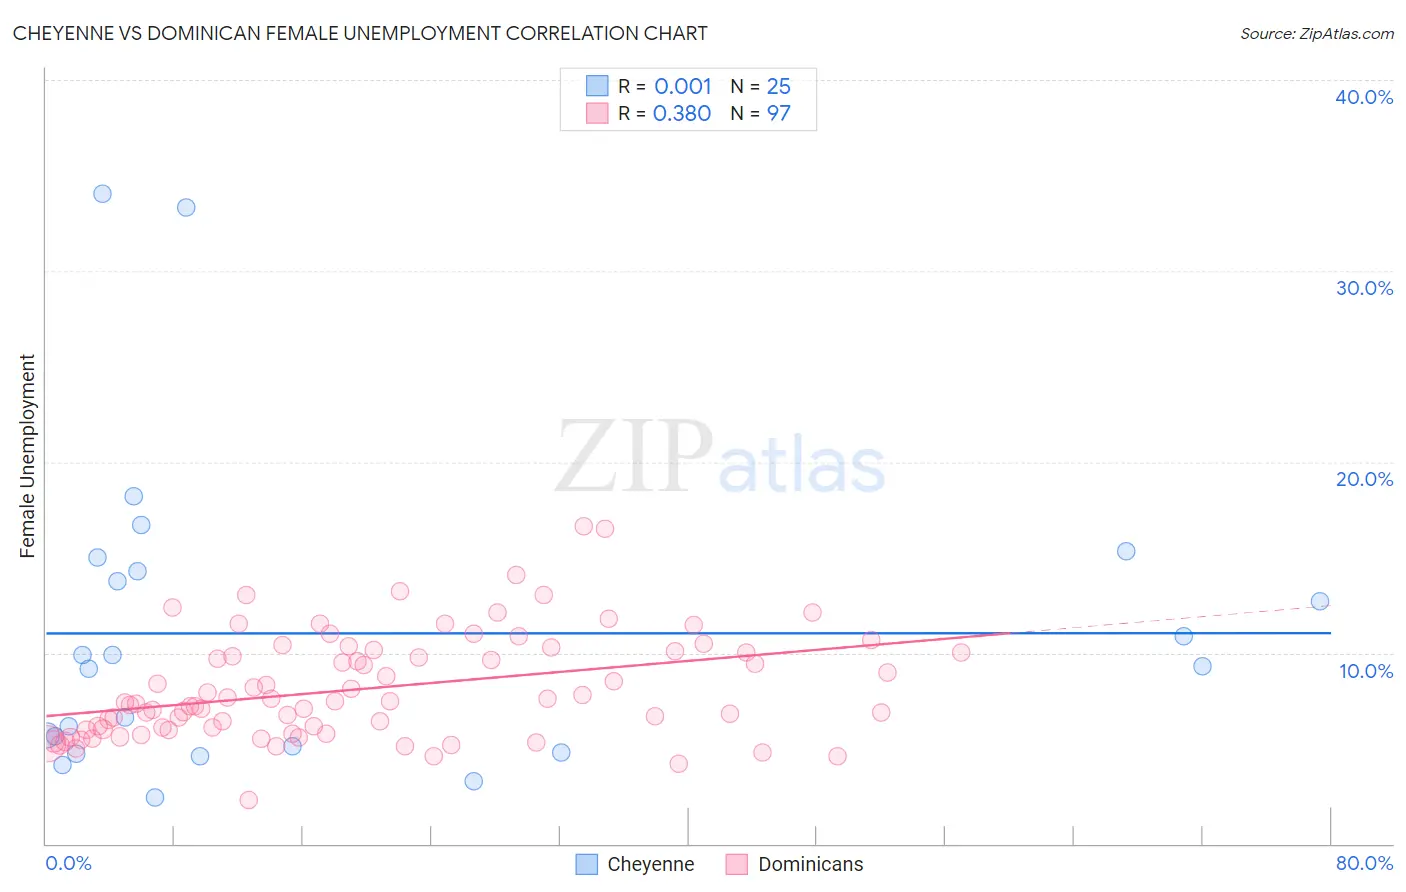
Cheyenne vs Dominican Female Unemployment Correlation Chart
The statistical analysis conducted on geographies consisting of 80,481,122 people shows no correlation between the proportion of Cheyenne and unemploymnet rate among females in the United States with a correlation coefficient (R) of 0.001 and weighted average of 6.6%. Similarly, the statistical analysis conducted on geographies consisting of 353,758,930 people shows a mild positive correlation between the proportion of Dominicans and unemploymnet rate among females in the United States with a correlation coefficient (R) of 0.380 and weighted average of 7.2%, a difference of 9.1%.
Female Unemployment Correlation Summary
| Measurement | Cheyenne | Dominican |
| Minimum | 2.4% | 2.3% |
| Maximum | 34.0% | 16.7% |
| Range | 31.6% | 14.4% |
| Mean | 11.0% | 8.1% |
| Median | 9.3% | 7.4% |
| Interquartile 25% (IQ1) | 5.0% | 6.0% |
| Interquartile 75% (IQ3) | 14.6% | 10.1% |
| Interquartile Range (IQR) | 9.7% | 4.1% |
| Standard Deviation (Sample) | 8.2% | 2.8% |
| Standard Deviation (Population) | 8.0% | 2.7% |
Demographics Similar to Cheyenne and Dominicans by Female Unemployment
In terms of female unemployment, the demographic groups most similar to Cheyenne are Apache (6.6%, a difference of 0.27%), Native/Alaskan (6.6%, a difference of 0.83%), Alaska Native (6.6%, a difference of 0.91%), Immigrants from Belize (6.5%, a difference of 1.1%), and Vietnamese (6.5%, a difference of 1.2%). Similarly, the demographic groups most similar to Dominicans are Immigrants from Dominican Republic (7.2%, a difference of 0.64%), Immigrants from Armenia (7.1%, a difference of 1.4%), Navajo (7.3%, a difference of 1.6%), Menominee (7.0%, a difference of 1.8%), and Sioux (7.0%, a difference of 1.8%).
| Demographics | Rating | Rank | Female Unemployment |
| Immigrants | Bangladesh | 0.0 /100 | #319 | Tragic 6.5% |
| Immigrants | Dominica | 0.0 /100 | #320 | Tragic 6.5% |
| Blacks/African Americans | 0.0 /100 | #321 | Tragic 6.5% |
| Vietnamese | 0.0 /100 | #322 | Tragic 6.5% |
| Immigrants | Belize | 0.0 /100 | #323 | Tragic 6.5% |
| Cheyenne | 0.0 /100 | #324 | Tragic 6.6% |
| Apache | 0.0 /100 | #325 | Tragic 6.6% |
| Natives/Alaskans | 0.0 /100 | #326 | Tragic 6.6% |
| Alaska Natives | 0.0 /100 | #327 | Tragic 6.6% |
| Guyanese | 0.0 /100 | #328 | Tragic 6.7% |
| Immigrants | Guyana | 0.0 /100 | #329 | Tragic 6.7% |
| Yakama | 0.0 /100 | #330 | Tragic 6.7% |
| Paiute | 0.0 /100 | #331 | Tragic 6.8% |
| Sioux | 0.0 /100 | #332 | Tragic 7.0% |
| Menominee | 0.0 /100 | #333 | Tragic 7.0% |
| Immigrants | Armenia | 0.0 /100 | #334 | Tragic 7.1% |
| Dominicans | 0.0 /100 | #335 | Tragic 7.2% |
| Immigrants | Dominican Republic | 0.0 /100 | #336 | Tragic 7.2% |
| Navajo | 0.0 /100 | #337 | Tragic 7.3% |
| Tohono O'odham | 0.0 /100 | #338 | Tragic 7.7% |
| Immigrants | Yemen | 0.0 /100 | #339 | Tragic 7.8% |