Immigrants from Nigeria vs Dominican Female Unemployment
COMPARE
Immigrants from Nigeria
Dominican
Female Unemployment
Female Unemployment Comparison
Immigrants from Nigeria
Dominicans
5.8%
FEMALE UNEMPLOYMENT
0.1/ 100
METRIC RATING
262nd/ 347
METRIC RANK
7.2%
FEMALE UNEMPLOYMENT
0.0/ 100
METRIC RATING
335th/ 347
METRIC RANK
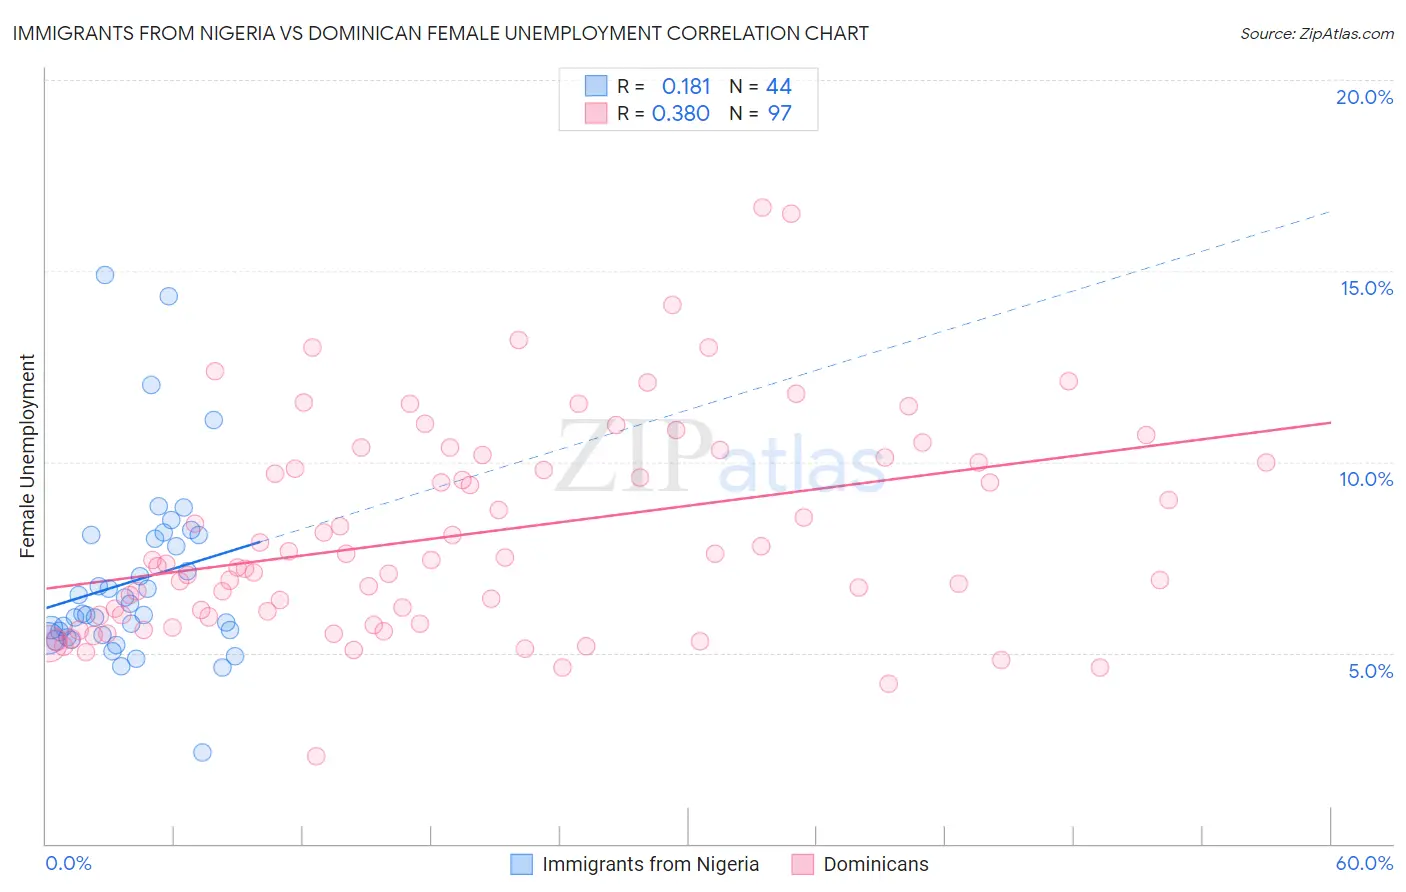
Immigrants from Nigeria vs Dominican Female Unemployment Correlation Chart
The statistical analysis conducted on geographies consisting of 283,043,160 people shows a poor positive correlation between the proportion of Immigrants from Nigeria and unemploymnet rate among females in the United States with a correlation coefficient (R) of 0.181 and weighted average of 5.8%. Similarly, the statistical analysis conducted on geographies consisting of 353,758,930 people shows a mild positive correlation between the proportion of Dominicans and unemploymnet rate among females in the United States with a correlation coefficient (R) of 0.380 and weighted average of 7.2%, a difference of 24.2%.
Female Unemployment Correlation Summary
| Measurement | Immigrants from Nigeria | Dominican |
| Minimum | 2.4% | 2.3% |
| Maximum | 14.9% | 16.7% |
| Range | 12.5% | 14.4% |
| Mean | 6.9% | 8.1% |
| Median | 6.0% | 7.4% |
| Interquartile 25% (IQ1) | 5.4% | 6.0% |
| Interquartile 75% (IQ3) | 8.0% | 10.1% |
| Interquartile Range (IQR) | 2.6% | 4.1% |
| Standard Deviation (Sample) | 2.4% | 2.8% |
| Standard Deviation (Population) | 2.4% | 2.7% |
Similar Demographics by Female Unemployment
Demographics Similar to Immigrants from Nigeria by Female Unemployment
In terms of female unemployment, the demographic groups most similar to Immigrants from Nigeria are Kiowa (5.8%, a difference of 0.030%), Nigerian (5.8%, a difference of 0.30%), Immigrants from Fiji (5.8%, a difference of 0.33%), Immigrants from Portugal (5.8%, a difference of 0.44%), and Immigrants from the Azores (5.8%, a difference of 0.67%).
| Demographics | Rating | Rank | Female Unemployment |
| Immigrants | Cameroon | 0.6 /100 | #255 | Tragic 5.7% |
| Sub-Saharan Africans | 0.4 /100 | #256 | Tragic 5.7% |
| Dutch West Indians | 0.3 /100 | #257 | Tragic 5.7% |
| Immigrants | Portugal | 0.2 /100 | #258 | Tragic 5.8% |
| Immigrants | Fiji | 0.2 /100 | #259 | Tragic 5.8% |
| Nigerians | 0.2 /100 | #260 | Tragic 5.8% |
| Kiowa | 0.1 /100 | #261 | Tragic 5.8% |
| Immigrants | Nigeria | 0.1 /100 | #262 | Tragic 5.8% |
| Immigrants | Azores | 0.1 /100 | #263 | Tragic 5.8% |
| Immigrants | Bahamas | 0.1 /100 | #264 | Tragic 5.8% |
| Blackfeet | 0.0 /100 | #265 | Tragic 5.9% |
| Cape Verdeans | 0.0 /100 | #266 | Tragic 5.9% |
| Nepalese | 0.0 /100 | #267 | Tragic 5.9% |
| Hondurans | 0.0 /100 | #268 | Tragic 5.9% |
| Immigrants | Western Africa | 0.0 /100 | #269 | Tragic 5.9% |
Demographics Similar to Dominicans by Female Unemployment
In terms of female unemployment, the demographic groups most similar to Dominicans are Immigrants from Dominican Republic (7.2%, a difference of 0.64%), Immigrants from Armenia (7.1%, a difference of 1.4%), Navajo (7.3%, a difference of 1.6%), Menominee (7.0%, a difference of 1.8%), and Sioux (7.0%, a difference of 1.8%).
| Demographics | Rating | Rank | Female Unemployment |
| Guyanese | 0.0 /100 | #328 | Tragic 6.7% |
| Immigrants | Guyana | 0.0 /100 | #329 | Tragic 6.7% |
| Yakama | 0.0 /100 | #330 | Tragic 6.7% |
| Paiute | 0.0 /100 | #331 | Tragic 6.8% |
| Sioux | 0.0 /100 | #332 | Tragic 7.0% |
| Menominee | 0.0 /100 | #333 | Tragic 7.0% |
| Immigrants | Armenia | 0.0 /100 | #334 | Tragic 7.1% |
| Dominicans | 0.0 /100 | #335 | Tragic 7.2% |
| Immigrants | Dominican Republic | 0.0 /100 | #336 | Tragic 7.2% |
| Navajo | 0.0 /100 | #337 | Tragic 7.3% |
| Tohono O'odham | 0.0 /100 | #338 | Tragic 7.7% |
| Immigrants | Yemen | 0.0 /100 | #339 | Tragic 7.8% |
| Hopi | 0.0 /100 | #340 | Tragic 8.1% |
| Inupiat | 0.0 /100 | #341 | Tragic 8.2% |
| Puerto Ricans | 0.0 /100 | #342 | Tragic 8.3% |