Immigrants from Taiwan vs Immigrants from St. Vincent and the Grenadines Female Unemployment

COMPARE

Immigrants from Taiwan
Race
Ancestry
AfghanAfricanAlaska NativeAlaskan AthabascanAlbanianAleutAlsatianAmericanApacheArabArapahoArgentineanArmenianAssyrian/Chaldean/SyriacAustralianAustrianBahamianBangladeshiBarbadianBasqueBelgianBelizeanBermudanBhutaneseBlackfeetBolivianBrazilianBritishBritish West IndianBulgarianBurmeseCajunCambodianCanadianCape VerdeanCarpatho RusynCelticCentral AmericanCentral American IndianCherokeeCheyenneChickasawChileanChineseChippewaChoctawColombianColvilleComancheCosta RicanCreeCreekCroatianCrowCubanCypriotCzechCzechoslovakianDanishDelawareDominicanDutchDutch West IndianEastern EuropeanEcuadorianEgyptianEnglishEstonianEthiopianEuropeanFijianFilipinoFinnishFrenchFrench American IndianFrench CanadianGermanGerman RussianGhanaianGreekGuamanian/ChamorroGuatemalanGuyaneseHaitianHmongHonduranHopiHoumaHungarianIcelanderIndian (Asian)IndonesianInupiatIranianIraqiIrishIroquoisIsraeliItalianJamaicanJapaneseJordanianKenyanKiowaKoreanLaotianLatvianLebaneseLiberianLithuanianLumbeeLuxembourgerMacedonianMalaysianMalteseMarshalleseMenomineeMexicanMexican American IndianMongolianMoroccanNative HawaiianNavajoNepaleseNew ZealanderNicaraguanNigerianNorthern EuropeanNorwegianOkinawanOsageOttawaPaiutePakistaniPalestinianPanamanianParaguayanPennsylvania GermanPeruvianPimaPolishPortuguesePotawatomiPuebloPuerto RicanPuget Sound SalishRomanianRussianSalvadoranSamoanScandinavianScotch-IrishScottishSeminoleSenegaleseSerbianShoshoneSierra LeoneanSiouxSlavicSlovakSloveneSomaliSouth AfricanSouth AmericanSouth American IndianSoviet UnionSpaniardSpanishSpanish AmericanSpanish American IndianSri LankanSubsaharan AfricanSudaneseSwedishSwissSyrianTaiwaneseThaiTlingit-HaidaTohono O'OdhamTonganTrinidadian and TobagonianTsimshianTurkishU.S. Virgin IslanderUgandanUkrainianUruguayanUteVenezuelanVietnameseWelshWest IndianYakamaYaquiYugoslavianYumanYup'ikZimbabwean
Immigration
NonimmigrantsImmigrantsAfghanistanAfricaAlbaniaArgentinaArmeniaAsiaAustraliaAustriaBahamasBangladeshBarbadosBelarusBelgiumBelizeBoliviaBosnia and HerzegovinaBrazilBulgariaBurma/MyanmarCabo VerdeCambodiaCameroonCanadaCaribbeanCentral AmericaChileChinaColombiaCongoCosta RicaCroatiaCubaCzechoslovakiaDenmarkDominicaDominican RepublicEastern AfricaEastern AsiaEastern EuropeEcuadorEgyptEl SalvadorEnglandEritreaEthiopiaEuropeFijiFranceGermanyGhanaGreeceGrenadaGuatemalaGuyanaHaitiHondurasHong KongHungaryIndiaIndonesiaIranIraqIrelandIsraelItalyJamaicaJapanJordanKazakhstanKenyaKoreaKuwaitLaosLatin AmericaLatviaLebanonLiberiaLithuaniaMalaysiaMexicoMicronesiaMiddle AfricaMoldovaMoroccoNepalNetherlandsNicaraguaNigeriaNorth AmericaNorth MacedoniaNorthern AfricaNorthern EuropeNorwayOceaniaPakistanPanamaPeruPhilippinesPolandPortugalRomaniaRussiaSaudi ArabiaScotlandSenegalSerbiaSierra LeoneSingaporeSomaliaSouth AfricaSouth AmericaSouth Central AsiaSouth Eastern AsiaSouthern EuropeSpainSri LankaSudanSwedenSwitzerlandSyriaTaiwanThailandTrinidad and TobagoTurkeyUgandaUkraineUruguayUzbekistanVenezuelaVietnamWest IndiesWestern AfricaWestern AsiaWestern EuropeYemenZaireZimbabweAzores
Immigrants from St. Vincent and the Grenadines
Race
Ancestry
AfghanAfricanAlaska NativeAlaskan AthabascanAlbanianAleutAlsatianAmericanApacheArabArapahoArgentineanArmenianAssyrian/Chaldean/SyriacAustralianAustrianBahamianBangladeshiBarbadianBasqueBelgianBelizeanBermudanBhutaneseBlackfeetBolivianBrazilianBritishBritish West IndianBulgarianBurmeseCajunCambodianCanadianCape VerdeanCarpatho RusynCelticCentral AmericanCentral American IndianCherokeeCheyenneChickasawChileanChineseChippewaChoctawColombianColvilleComancheCosta RicanCreeCreekCroatianCrowCubanCypriotCzechCzechoslovakianDanishDelawareDominicanDutchDutch West IndianEastern EuropeanEcuadorianEgyptianEnglishEstonianEthiopianEuropeanFijianFilipinoFinnishFrenchFrench American IndianFrench CanadianGermanGerman RussianGhanaianGreekGuamanian/ChamorroGuatemalanGuyaneseHaitianHmongHonduranHopiHoumaHungarianIcelanderIndian (Asian)IndonesianInupiatIranianIraqiIrishIroquoisIsraeliItalianJamaicanJapaneseJordanianKenyanKiowaKoreanLaotianLatvianLebaneseLiberianLithuanianLumbeeLuxembourgerMacedonianMalaysianMalteseMarshalleseMenomineeMexicanMexican American IndianMongolianMoroccanNative HawaiianNavajoNepaleseNew ZealanderNicaraguanNigerianNorthern EuropeanNorwegianOkinawanOsageOttawaPaiutePakistaniPalestinianPanamanianParaguayanPennsylvania GermanPeruvianPimaPolishPortuguesePotawatomiPuebloPuerto RicanPuget Sound SalishRomanianRussianSalvadoranSamoanScandinavianScotch-IrishScottishSeminoleSenegaleseSerbianShoshoneSierra LeoneanSiouxSlavicSlovakSloveneSomaliSouth AfricanSouth AmericanSouth American IndianSoviet UnionSpaniardSpanishSpanish AmericanSpanish American IndianSri LankanSubsaharan AfricanSudaneseSwedishSwissSyrianTaiwaneseThaiTlingit-HaidaTohono O'OdhamTonganTrinidadian and TobagonianTsimshianTurkishU.S. Virgin IslanderUgandanUkrainianUruguayanUteVenezuelanVietnameseWelshWest IndianYakamaYaquiYugoslavianYumanYup'ikZimbabwean
Immigration
NonimmigrantsImmigrantsAfghanistanAfricaAlbaniaArgentinaArmeniaAsiaAustraliaAustriaBahamasBangladeshBarbadosBelarusBelgiumBelizeBoliviaBosnia and HerzegovinaBrazilBulgariaBurma/MyanmarCabo VerdeCambodiaCameroonCanadaCaribbeanCentral AmericaChileChinaColombiaCongoCosta RicaCroatiaCubaCzechoslovakiaDenmarkDominicaDominican RepublicEastern AfricaEastern AsiaEastern EuropeEcuadorEgyptEl SalvadorEnglandEritreaEthiopiaEuropeFijiFranceGermanyGhanaGreeceGrenadaGuatemalaGuyanaHaitiHondurasHong KongHungaryIndiaIndonesiaIranIraqIrelandIsraelItalyJamaicaJapanJordanKazakhstanKenyaKoreaKuwaitLaosLatin AmericaLatviaLebanonLiberiaLithuaniaMalaysiaMexicoMicronesiaMiddle AfricaMoldovaMoroccoNepalNetherlandsNicaraguaNigeriaNorth AmericaNorth MacedoniaNorthern AfricaNorthern EuropeNorwayOceaniaPakistanPanamaPeruPhilippinesPolandPortugalRomaniaRussiaSaudi ArabiaScotlandSenegalSerbiaSierra LeoneSingaporeSomaliaSouth AfricaSouth AmericaSouth Central AsiaSouth Eastern AsiaSouthern EuropeSpainSri LankaSt. Vincent and the GrenadinesSudanSwedenSwitzerlandSyriaThailandTrinidad and TobagoTurkeyUgandaUkraineUruguayUzbekistanVenezuelaVietnamWest IndiesWestern AfricaWestern AsiaWestern EuropeYemenZaireZimbabweAzores
Female Unemployment
Income
Poverty
Unemployment
Labor Participation
Family Structure
Vehicle Availability
Education Level
Disability

Female Unemployment Comparison

Immigrants from Taiwan

Immigrants from St. Vincent and the Grenadines

Exceptional
Tragic
5.0%
FEMALE UNEMPLOYMENT
96.6/ 100
METRIC RATING
89th/ 347
METRIC RANK
6.4%
FEMALE UNEMPLOYMENT
0.0/ 100
METRIC RATING
317th/ 347
METRIC RANK

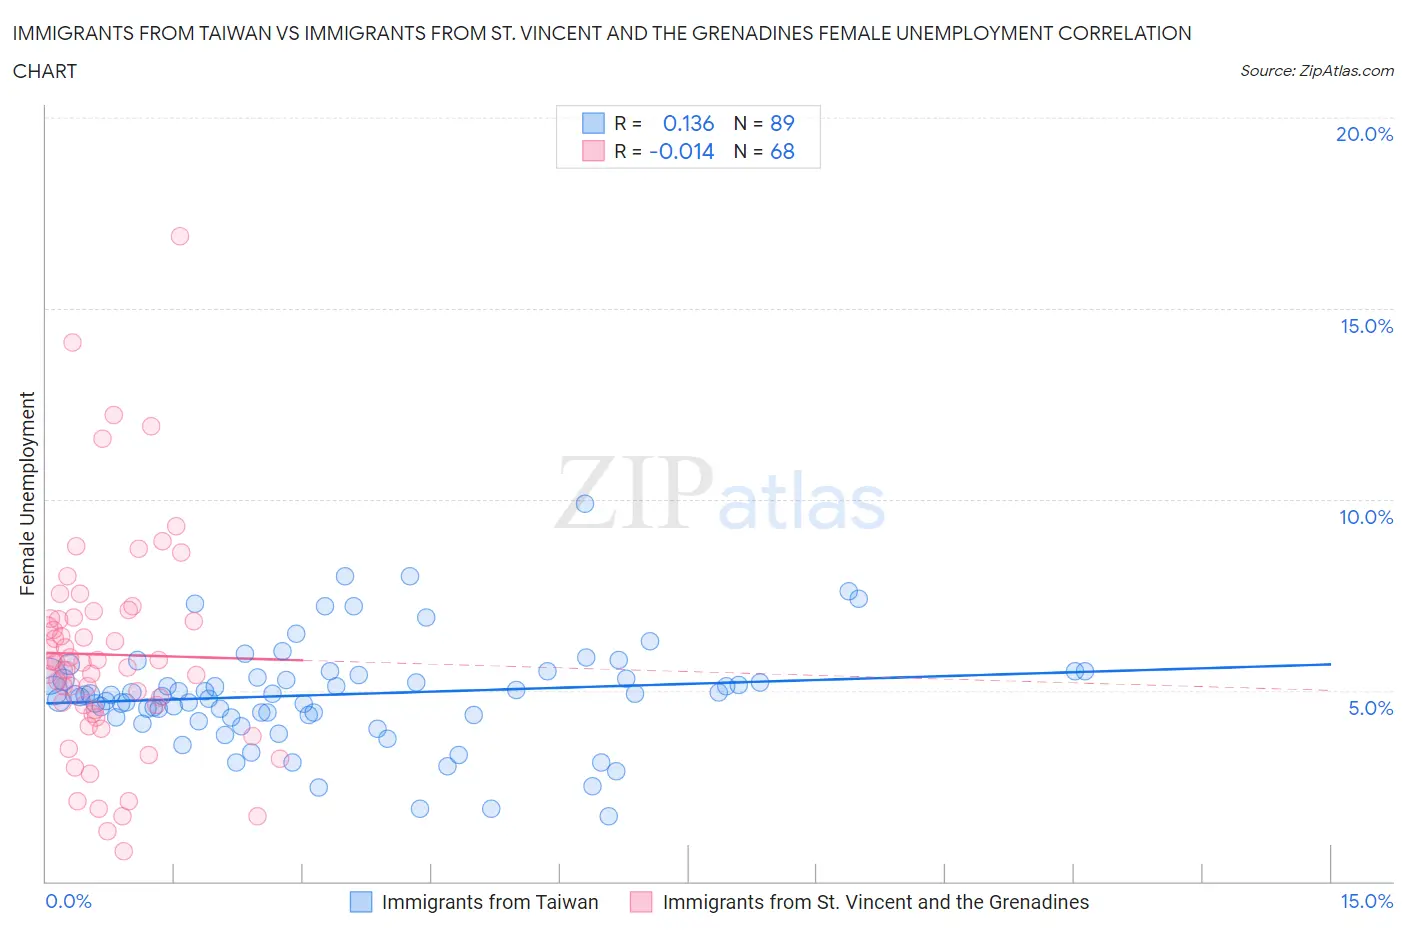
Immigrants from Taiwan vs Immigrants from St. Vincent and the Grenadines Female Unemployment Correlation Chart

The statistical analysis conducted on geographies consisting of 297,604,617 people shows a poor positive correlation between the proportion of Immigrants from Taiwan and unemploymnet rate among females in the United States with a correlation coefficient (R) of 0.136 and weighted average of 5.0%. Similarly, the statistical analysis conducted on geographies consisting of 56,165,635 people shows no correlation between the proportion of Immigrants from St. Vincent and the Grenadines and unemploymnet rate among females in the United States with a correlation coefficient (R) of -0.014 and weighted average of 6.4%, a difference of 28.7%.
Immigrants from Taiwan vs Immigrants from St. Vincent and the Grenadines Female Unemployment

Female Unemployment Correlation Summary

MeasurementImmigrants from TaiwanImmigrants from St. Vincent and the Grenadines
Minimum1.7%0.80%
Maximum9.9%16.9%
Range8.2%16.1%
Mean4.9%5.9%
Median4.9%5.7%
Interquartile 25% (IQ1)4.3%4.4%
Interquartile 75% (IQ3)5.4%6.9%
Interquartile Range (IQR)1.1%2.5%
Standard Deviation (Sample)1.4%2.9%
Standard Deviation (Population)1.4%2.9%

Similar Demographics by Female Unemployment

Demographics Similar to Immigrants from Taiwan by Female Unemployment

In terms of female unemployment, the demographic groups most similar to Immigrants from Taiwan are Immigrants from Sudan (5.0%, a difference of 0.060%), Venezuelan (5.0%, a difference of 0.15%), Immigrants from Sweden (5.0%, a difference of 0.17%), Bolivian (5.0%, a difference of 0.23%), and Ukrainian (5.0%, a difference of 0.24%).
DemographicsRating | RankFemale Unemployment
Immigrants | Australia
97.3
/100
|
#82
Exceptional
5.0%
Immigrants | Serbia
97.2
/100
|
#83
Exceptional
5.0%
Canadians
97.2
/100
|
#84
Exceptional
5.0%
Ukrainians
97.1
/100
|
#85
Exceptional
5.0%
Bolivians
97.1
/100
|
#86
Exceptional
5.0%
Venezuelans
96.9
/100
|
#87
Exceptional
5.0%
Immigrants | Sudan
96.7
/100
|
#88
Exceptional
5.0%
Immigrants | Taiwan
96.6
/100
|
#89
Exceptional
5.0%
Immigrants | Sweden
96.3
/100
|
#90
Exceptional
5.0%
Immigrants | Japan
96.0
/100
|
#91
Exceptional
5.0%
Romanians
95.9
/100
|
#92
Exceptional
5.0%
Immigrants | Austria
95.7
/100
|
#93
Exceptional
5.0%
Immigrants | Malaysia
95.7
/100
|
#94
Exceptional
5.0%
Burmese
95.6
/100
|
#95
Exceptional
5.0%
Immigrants | South Central Asia
95.5
/100
|
#96
Exceptional
5.0%

Demographics Similar to Immigrants from St. Vincent and the Grenadines by Female Unemployment

In terms of female unemployment, the demographic groups most similar to Immigrants from St. Vincent and the Grenadines are British West Indian (6.4%, a difference of 0.28%), Houma (6.4%, a difference of 0.45%), Immigrants from Bangladesh (6.5%, a difference of 0.47%), Immigrants from Dominica (6.5%, a difference of 0.48%), and Pueblo (6.4%, a difference of 0.74%).
DemographicsRating | RankFemale Unemployment
Central American Indians
0.0
/100
|
#310
Tragic
6.3%
Immigrants | Mexico
0.0
/100
|
#311
Tragic
6.3%
Immigrants | Grenada
0.0
/100
|
#312
Tragic
6.3%
Belizeans
0.0
/100
|
#313
Tragic
6.3%
Immigrants | Ecuador
0.0
/100
|
#314
Tragic
6.4%
Pueblo
0.0
/100
|
#315
Tragic
6.4%
Houma
0.0
/100
|
#316
Tragic
6.4%
Immigrants | St. Vincent and the Grenadines
0.0
/100
|
#317
Tragic
6.4%
British West Indians
0.0
/100
|
#318
Tragic
6.4%
Immigrants | Bangladesh
0.0
/100
|
#319
Tragic
6.5%
Immigrants | Dominica
0.0
/100
|
#320
Tragic
6.5%
Blacks/African Americans
0.0
/100
|
#321
Tragic
6.5%
Vietnamese
0.0
/100
|
#322
Tragic
6.5%
Immigrants | Belize
0.0
/100
|
#323
Tragic
6.5%
Cheyenne
0.0
/100
|
#324
Tragic
6.6%