Okinawan vs Yuman Unemployment Among Women with Children Ages 6 to 17 years
COMPARE
Okinawan
Yuman
Unemployment Among Women with Children Ages 6 to 17 years
Unemployment Among Women with Children Ages 6 to 17 years Comparison
Okinawans
Yuman
7.0%
UNEMPLOYMENT AMONG WOMEN WITH CHILDREN AGES 6 TO 17 YEARS
100.0/ 100
METRIC RATING
5th/ 347
METRIC RANK
14.8%
UNEMPLOYMENT AMONG WOMEN WITH CHILDREN AGES 6 TO 17 YEARS
0.0/ 100
METRIC RATING
342nd/ 347
METRIC RANK
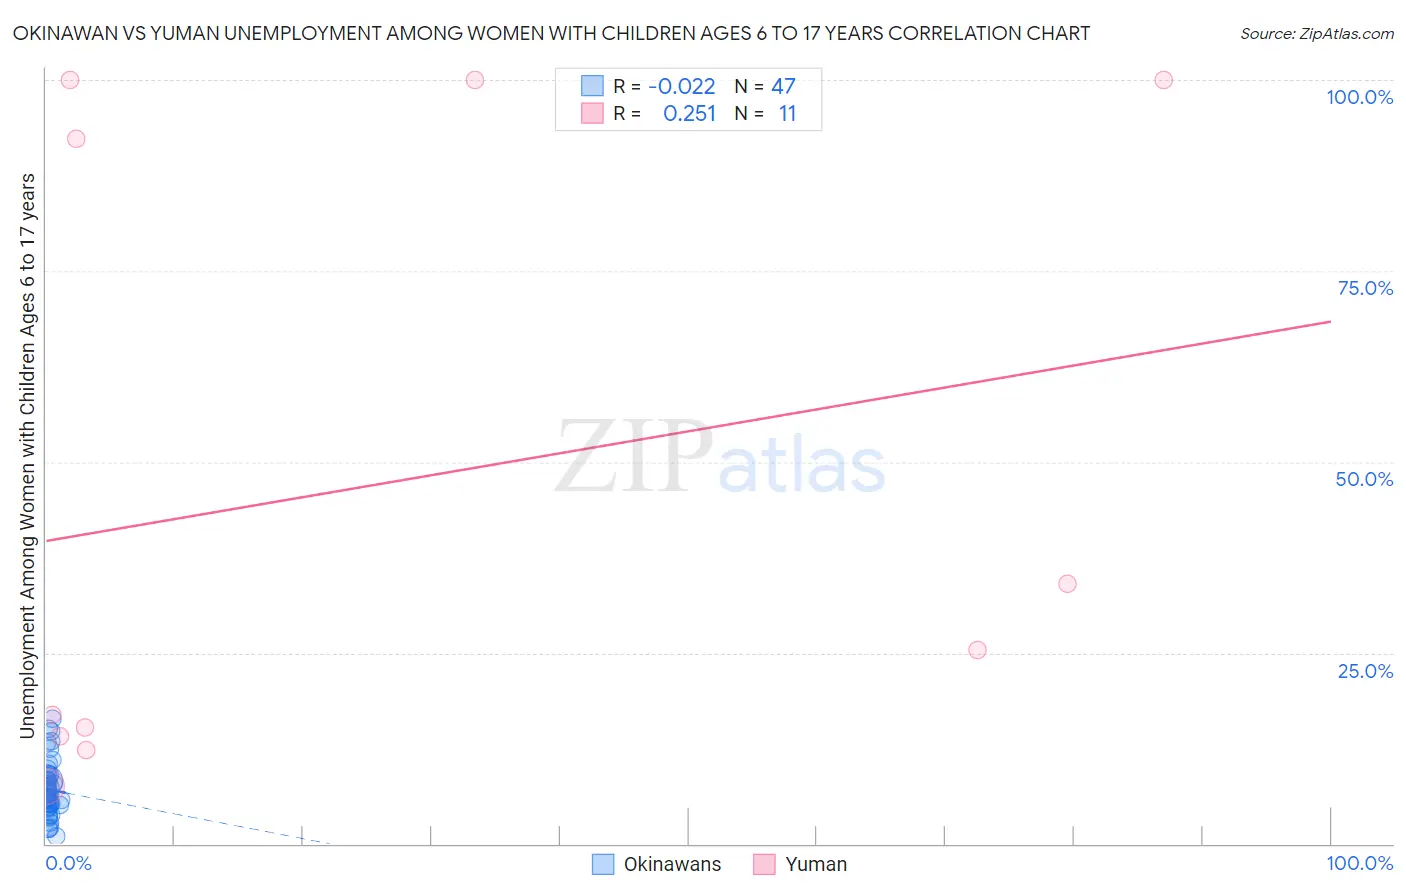
Okinawan vs Yuman Unemployment Among Women with Children Ages 6 to 17 years Correlation Chart
The statistical analysis conducted on geographies consisting of 65,822,820 people shows no correlation between the proportion of Okinawans and unemployment rate among women with children between the ages 6 and 17 in the United States with a correlation coefficient (R) of -0.022 and weighted average of 7.0%. Similarly, the statistical analysis conducted on geographies consisting of 38,308,560 people shows a weak positive correlation between the proportion of Yuman and unemployment rate among women with children between the ages 6 and 17 in the United States with a correlation coefficient (R) of 0.251 and weighted average of 14.8%, a difference of 110.1%.
Unemployment Among Women with Children Ages 6 to 17 years Correlation Summary
| Measurement | Okinawan | Yuman |
| Minimum | 1.0% | 7.5% |
| Maximum | 16.4% | 100.0% |
| Range | 15.4% | 92.5% |
| Mean | 7.1% | 47.1% |
| Median | 6.1% | 25.4% |
| Interquartile 25% (IQ1) | 4.8% | 14.1% |
| Interquartile 75% (IQ3) | 8.9% | 100.0% |
| Interquartile Range (IQR) | 4.1% | 85.9% |
| Standard Deviation (Sample) | 3.6% | 41.1% |
| Standard Deviation (Population) | 3.5% | 39.2% |
Similar Demographics by Unemployment Among Women with Children Ages 6 to 17 years
Demographics Similar to Okinawans by Unemployment Among Women with Children Ages 6 to 17 years
In terms of unemployment among women with children ages 6 to 17 years, the demographic groups most similar to Okinawans are Tlingit-Haida (7.1%, a difference of 0.47%), Soviet Union (7.1%, a difference of 0.53%), Ute (7.0%, a difference of 0.60%), Immigrants from Hong Kong (7.2%, a difference of 2.0%), and Assyrian/Chaldean/Syriac (7.2%, a difference of 2.3%).
| Demographics | Rating | Rank | Unemployment Among Women with Children Ages 6 to 17 years |
| Taiwanese | 100.0 /100 | #1 | Exceptional 6.5% |
| Fijians | 100.0 /100 | #2 | Exceptional 6.6% |
| Tongans | 100.0 /100 | #3 | Exceptional 6.7% |
| Ute | 100.0 /100 | #4 | Exceptional 7.0% |
| Okinawans | 100.0 /100 | #5 | Exceptional 7.0% |
| Tlingit-Haida | 100.0 /100 | #6 | Exceptional 7.1% |
| Soviet Union | 100.0 /100 | #7 | Exceptional 7.1% |
| Immigrants | Hong Kong | 100.0 /100 | #8 | Exceptional 7.2% |
| Assyrians/Chaldeans/Syriacs | 100.0 /100 | #9 | Exceptional 7.2% |
| Immigrants | Fiji | 100.0 /100 | #10 | Exceptional 7.3% |
| Immigrants | Taiwan | 100.0 /100 | #11 | Exceptional 7.3% |
| Bangladeshis | 100.0 /100 | #12 | Exceptional 7.4% |
| Indonesians | 100.0 /100 | #13 | Exceptional 7.4% |
| Sudanese | 100.0 /100 | #14 | Exceptional 7.4% |
| Puget Sound Salish | 100.0 /100 | #15 | Exceptional 7.5% |
Demographics Similar to Yuman by Unemployment Among Women with Children Ages 6 to 17 years
In terms of unemployment among women with children ages 6 to 17 years, the demographic groups most similar to Yuman are Inupiat (14.9%, a difference of 0.29%), Navajo (14.2%, a difference of 4.6%), Puerto Rican (13.9%, a difference of 6.8%), Cheyenne (16.4%, a difference of 10.6%), and Sioux (13.2%, a difference of 11.9%).
| Demographics | Rating | Rank | Unemployment Among Women with Children Ages 6 to 17 years |
| Natives/Alaskans | 0.0 /100 | #333 | Tragic 11.5% |
| Ugandans | 0.0 /100 | #334 | Tragic 12.0% |
| Colville | 0.0 /100 | #335 | Tragic 12.3% |
| Houma | 0.0 /100 | #336 | Tragic 12.5% |
| Immigrants | Yemen | 0.0 /100 | #337 | Tragic 12.7% |
| Hopi | 0.0 /100 | #338 | Tragic 12.9% |
| Sioux | 0.0 /100 | #339 | Tragic 13.2% |
| Puerto Ricans | 0.0 /100 | #340 | Tragic 13.9% |
| Navajo | 0.0 /100 | #341 | Tragic 14.2% |
| Yuman | 0.0 /100 | #342 | Tragic 14.8% |
| Inupiat | 0.0 /100 | #343 | Tragic 14.9% |
| Cheyenne | 0.0 /100 | #344 | Tragic 16.4% |
| Arapaho | 0.0 /100 | #345 | Tragic 16.8% |
| Yup'ik | 0.0 /100 | #346 | Tragic 18.6% |
| Pima | 0.0 /100 | #347 | Tragic 18.9% |