Okinawan vs Immigrants from Canada Unemployment Among Women with Children Ages 6 to 17 years
COMPARE
Okinawan
Immigrants from Canada
Unemployment Among Women with Children Ages 6 to 17 years
Unemployment Among Women with Children Ages 6 to 17 years Comparison
Okinawans
Immigrants from Canada
7.0%
UNEMPLOYMENT AMONG WOMEN WITH CHILDREN AGES 6 TO 17 YEARS
100.0/ 100
METRIC RATING
5th/ 347
METRIC RANK
9.1%
UNEMPLOYMENT AMONG WOMEN WITH CHILDREN AGES 6 TO 17 YEARS
15.3/ 100
METRIC RATING
204th/ 347
METRIC RANK
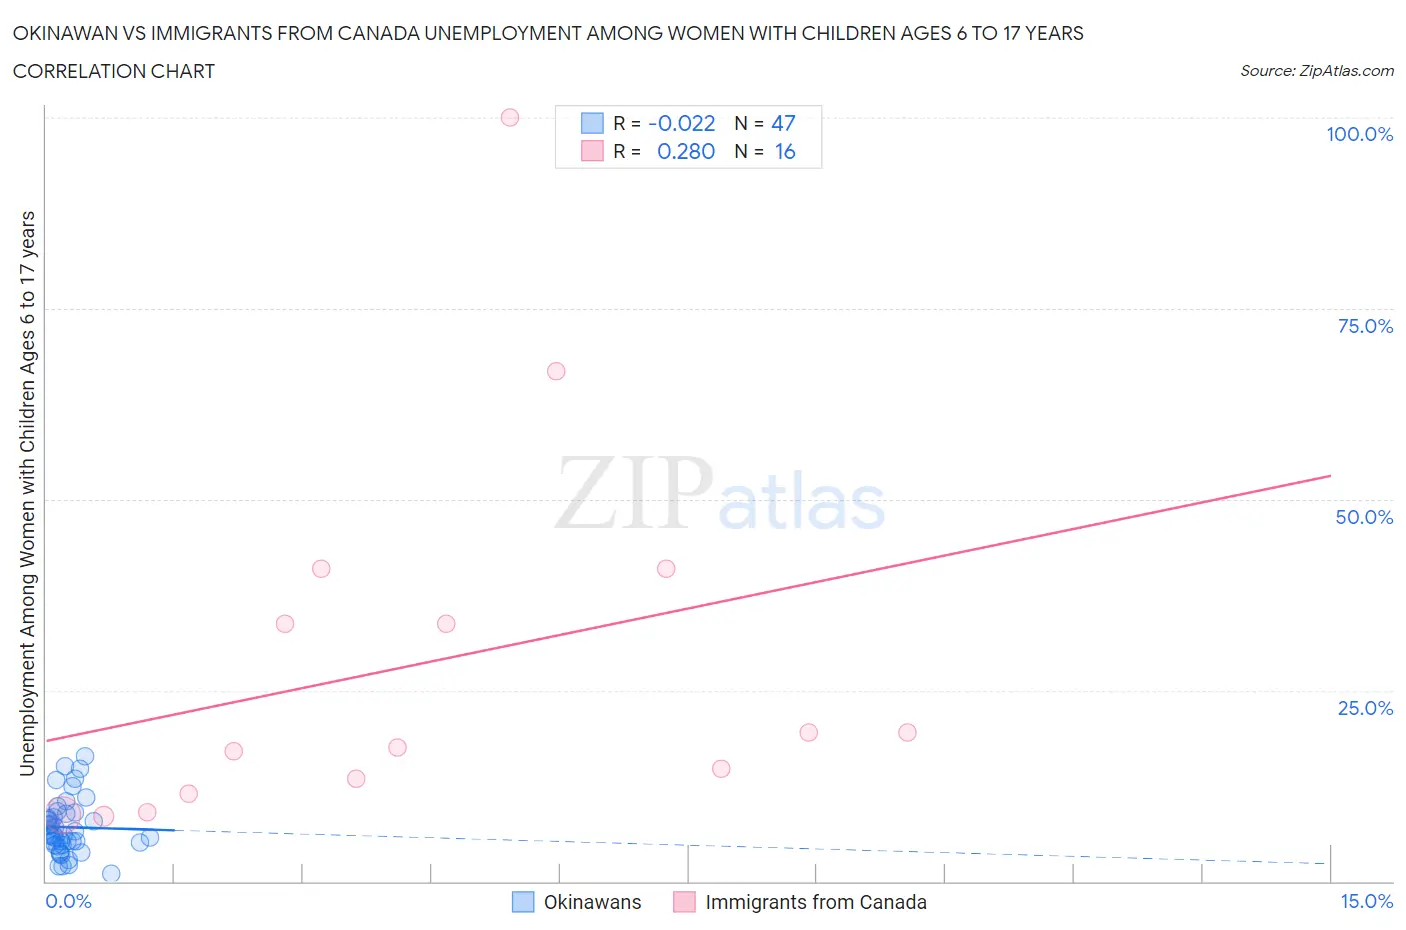
Okinawan vs Immigrants from Canada Unemployment Among Women with Children Ages 6 to 17 years Correlation Chart
The statistical analysis conducted on geographies consisting of 65,822,820 people shows no correlation between the proportion of Okinawans and unemployment rate among women with children between the ages 6 and 17 in the United States with a correlation coefficient (R) of -0.022 and weighted average of 7.0%. Similarly, the statistical analysis conducted on geographies consisting of 311,602,317 people shows a weak positive correlation between the proportion of Immigrants from Canada and unemployment rate among women with children between the ages 6 and 17 in the United States with a correlation coefficient (R) of 0.280 and weighted average of 9.1%, a difference of 29.6%.
Unemployment Among Women with Children Ages 6 to 17 years Correlation Summary
| Measurement | Okinawan | Immigrants from Canada |
| Minimum | 1.0% | 8.5% |
| Maximum | 16.4% | 100.0% |
| Range | 15.4% | 91.5% |
| Mean | 7.1% | 28.4% |
| Median | 6.1% | 18.5% |
| Interquartile 25% (IQ1) | 4.8% | 12.4% |
| Interquartile 75% (IQ3) | 8.9% | 37.3% |
| Interquartile Range (IQR) | 4.1% | 24.9% |
| Standard Deviation (Sample) | 3.6% | 24.8% |
| Standard Deviation (Population) | 3.5% | 24.0% |
Similar Demographics by Unemployment Among Women with Children Ages 6 to 17 years
Demographics Similar to Okinawans by Unemployment Among Women with Children Ages 6 to 17 years
In terms of unemployment among women with children ages 6 to 17 years, the demographic groups most similar to Okinawans are Tlingit-Haida (7.1%, a difference of 0.47%), Soviet Union (7.1%, a difference of 0.53%), Ute (7.0%, a difference of 0.60%), Immigrants from Hong Kong (7.2%, a difference of 2.0%), and Assyrian/Chaldean/Syriac (7.2%, a difference of 2.3%).
| Demographics | Rating | Rank | Unemployment Among Women with Children Ages 6 to 17 years |
| Taiwanese | 100.0 /100 | #1 | Exceptional 6.5% |
| Fijians | 100.0 /100 | #2 | Exceptional 6.6% |
| Tongans | 100.0 /100 | #3 | Exceptional 6.7% |
| Ute | 100.0 /100 | #4 | Exceptional 7.0% |
| Okinawans | 100.0 /100 | #5 | Exceptional 7.0% |
| Tlingit-Haida | 100.0 /100 | #6 | Exceptional 7.1% |
| Soviet Union | 100.0 /100 | #7 | Exceptional 7.1% |
| Immigrants | Hong Kong | 100.0 /100 | #8 | Exceptional 7.2% |
| Assyrians/Chaldeans/Syriacs | 100.0 /100 | #9 | Exceptional 7.2% |
| Immigrants | Fiji | 100.0 /100 | #10 | Exceptional 7.3% |
| Immigrants | Taiwan | 100.0 /100 | #11 | Exceptional 7.3% |
| Bangladeshis | 100.0 /100 | #12 | Exceptional 7.4% |
| Indonesians | 100.0 /100 | #13 | Exceptional 7.4% |
| Sudanese | 100.0 /100 | #14 | Exceptional 7.4% |
| Puget Sound Salish | 100.0 /100 | #15 | Exceptional 7.5% |
Demographics Similar to Immigrants from Canada by Unemployment Among Women with Children Ages 6 to 17 years
In terms of unemployment among women with children ages 6 to 17 years, the demographic groups most similar to Immigrants from Canada are Maltese (9.1%, a difference of 0.0%), Immigrants from Middle Africa (9.1%, a difference of 0.020%), Immigrants from Western Europe (9.1%, a difference of 0.10%), Immigrants from Trinidad and Tobago (9.1%, a difference of 0.12%), and Trinidadian and Tobagonian (9.1%, a difference of 0.23%).
| Demographics | Rating | Rank | Unemployment Among Women with Children Ages 6 to 17 years |
| Immigrants | Panama | 24.3 /100 | #197 | Fair 9.1% |
| Guyanese | 21.8 /100 | #198 | Fair 9.1% |
| Czechoslovakians | 20.8 /100 | #199 | Fair 9.1% |
| Trinidadians and Tobagonians | 18.2 /100 | #200 | Poor 9.1% |
| Immigrants | Trinidad and Tobago | 16.7 /100 | #201 | Poor 9.1% |
| Immigrants | Middle Africa | 15.6 /100 | #202 | Poor 9.1% |
| Maltese | 15.3 /100 | #203 | Poor 9.1% |
| Immigrants | Canada | 15.3 /100 | #204 | Poor 9.1% |
| Immigrants | Western Europe | 14.1 /100 | #205 | Poor 9.1% |
| Immigrants | North America | 12.7 /100 | #206 | Poor 9.2% |
| Cubans | 10.9 /100 | #207 | Poor 9.2% |
| Immigrants | Peru | 10.8 /100 | #208 | Poor 9.2% |
| Salvadorans | 10.7 /100 | #209 | Poor 9.2% |
| Finns | 10.0 /100 | #210 | Tragic 9.2% |
| Immigrants | Cuba | 9.6 /100 | #211 | Tragic 9.2% |