Norwegian vs Immigrants from Bulgaria Unemployment Among Youth under 25 years
COMPARE
Norwegian
Immigrants from Bulgaria
Unemployment Among Youth under 25 years
Unemployment Among Youth under 25 years Comparison
Norwegians
Immigrants from Bulgaria
9.8%
UNEMPLOYMENT AMONG YOUTH UNDER 25 YEARS
100.0/ 100
METRIC RATING
1st/ 347
METRIC RANK
11.2%
UNEMPLOYMENT AMONG YOUTH UNDER 25 YEARS
96.4/ 100
METRIC RATING
80th/ 347
METRIC RANK
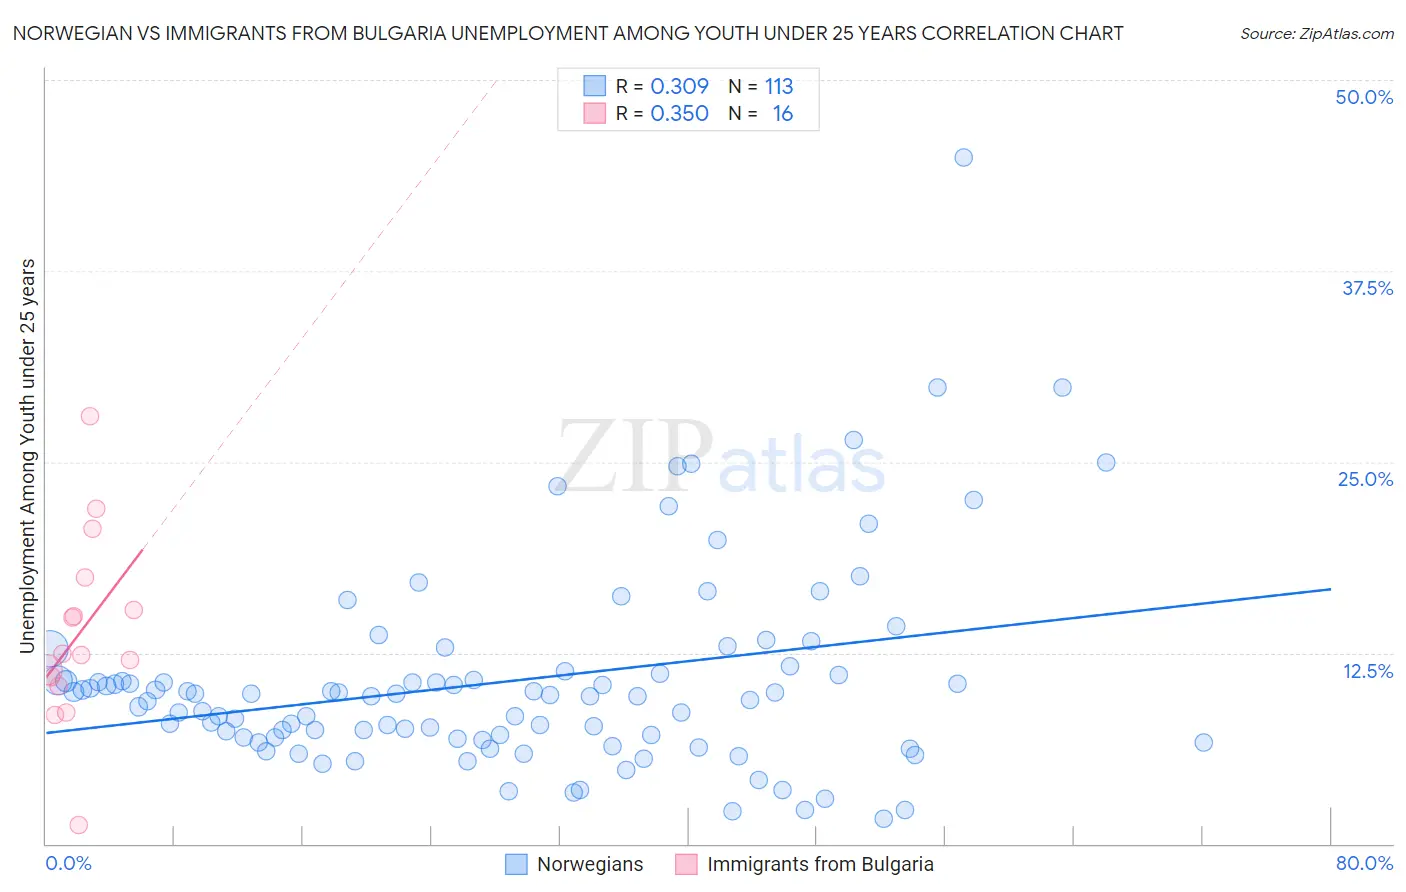
Norwegian vs Immigrants from Bulgaria Unemployment Among Youth under 25 years Correlation Chart
The statistical analysis conducted on geographies consisting of 514,614,571 people shows a mild positive correlation between the proportion of Norwegians and unemployment rate among youth under the age of 25 in the United States with a correlation coefficient (R) of 0.309 and weighted average of 9.8%. Similarly, the statistical analysis conducted on geographies consisting of 171,741,074 people shows a mild positive correlation between the proportion of Immigrants from Bulgaria and unemployment rate among youth under the age of 25 in the United States with a correlation coefficient (R) of 0.350 and weighted average of 11.2%, a difference of 13.9%.
Unemployment Among Youth under 25 years Correlation Summary
| Measurement | Norwegian | Immigrants from Bulgaria |
| Minimum | 1.6% | 1.2% |
| Maximum | 44.9% | 28.0% |
| Range | 43.3% | 26.8% |
| Mean | 10.6% | 13.8% |
| Median | 9.6% | 12.4% |
| Interquartile 25% (IQ1) | 6.9% | 10.6% |
| Interquartile 75% (IQ3) | 11.1% | 16.4% |
| Interquartile Range (IQR) | 4.2% | 5.8% |
| Standard Deviation (Sample) | 6.6% | 6.2% |
| Standard Deviation (Population) | 6.6% | 6.0% |
Similar Demographics by Unemployment Among Youth under 25 years
Demographics Similar to Norwegians by Unemployment Among Youth under 25 years
In terms of unemployment among youth under 25 years, the demographic groups most similar to Norwegians are Immigrants from Cuba (10.0%, a difference of 1.6%), Luxembourger (10.0%, a difference of 1.8%), Zimbabwean (10.2%, a difference of 3.5%), Czech (10.3%, a difference of 4.6%), and Danish (10.3%, a difference of 4.8%).
| Demographics | Rating | Rank | Unemployment Among Youth under 25 years |
| Norwegians | 100.0 /100 | #1 | Exceptional 9.8% |
| Immigrants | Cuba | 100.0 /100 | #2 | Exceptional 10.0% |
| Luxembourgers | 100.0 /100 | #3 | Exceptional 10.0% |
| Zimbabweans | 100.0 /100 | #4 | Exceptional 10.2% |
| Czechs | 100.0 /100 | #5 | Exceptional 10.3% |
| Danes | 100.0 /100 | #6 | Exceptional 10.3% |
| Swedes | 100.0 /100 | #7 | Exceptional 10.4% |
| Immigrants | Venezuela | 100.0 /100 | #8 | Exceptional 10.5% |
| Germans | 100.0 /100 | #9 | Exceptional 10.5% |
| Immigrants | Somalia | 100.0 /100 | #10 | Exceptional 10.5% |
| Scandinavians | 100.0 /100 | #11 | Exceptional 10.5% |
| Immigrants | Sudan | 100.0 /100 | #12 | Exceptional 10.5% |
| Indonesians | 100.0 /100 | #13 | Exceptional 10.6% |
| Cubans | 100.0 /100 | #14 | Exceptional 10.6% |
| Sudanese | 100.0 /100 | #15 | Exceptional 10.6% |
Demographics Similar to Immigrants from Bulgaria by Unemployment Among Youth under 25 years
In terms of unemployment among youth under 25 years, the demographic groups most similar to Immigrants from Bulgaria are Icelander (11.2%, a difference of 0.050%), Northern European (11.2%, a difference of 0.060%), Immigrants from Canada (11.2%, a difference of 0.080%), Immigrants from Nicaragua (11.2%, a difference of 0.090%), and Bolivian (11.2%, a difference of 0.11%).
| Demographics | Rating | Rank | Unemployment Among Youth under 25 years |
| Creek | 97.2 /100 | #73 | Exceptional 11.2% |
| New Zealanders | 97.2 /100 | #74 | Exceptional 11.2% |
| French | 97.1 /100 | #75 | Exceptional 11.2% |
| German Russians | 97.0 /100 | #76 | Exceptional 11.2% |
| Whites/Caucasians | 96.9 /100 | #77 | Exceptional 11.2% |
| Immigrants | Nicaragua | 96.7 /100 | #78 | Exceptional 11.2% |
| Immigrants | Canada | 96.7 /100 | #79 | Exceptional 11.2% |
| Immigrants | Bulgaria | 96.4 /100 | #80 | Exceptional 11.2% |
| Icelanders | 96.3 /100 | #81 | Exceptional 11.2% |
| Northern Europeans | 96.2 /100 | #82 | Exceptional 11.2% |
| Bolivians | 96.1 /100 | #83 | Exceptional 11.2% |
| French Canadians | 95.9 /100 | #84 | Exceptional 11.2% |
| Immigrants | South Central Asia | 95.9 /100 | #85 | Exceptional 11.2% |
| Immigrants | South Africa | 95.8 /100 | #86 | Exceptional 11.2% |
| Kenyans | 95.7 /100 | #87 | Exceptional 11.2% |