Norwegian vs Immigrants from China Unemployment Among Youth under 25 years
COMPARE
Norwegian
Immigrants from China
Unemployment Among Youth under 25 years
Unemployment Among Youth under 25 years Comparison
Norwegians
Immigrants from China
9.8%
UNEMPLOYMENT AMONG YOUTH UNDER 25 YEARS
100.0/ 100
METRIC RATING
1st/ 347
METRIC RANK
11.6%
UNEMPLOYMENT AMONG YOUTH UNDER 25 YEARS
50.0/ 100
METRIC RATING
174th/ 347
METRIC RANK
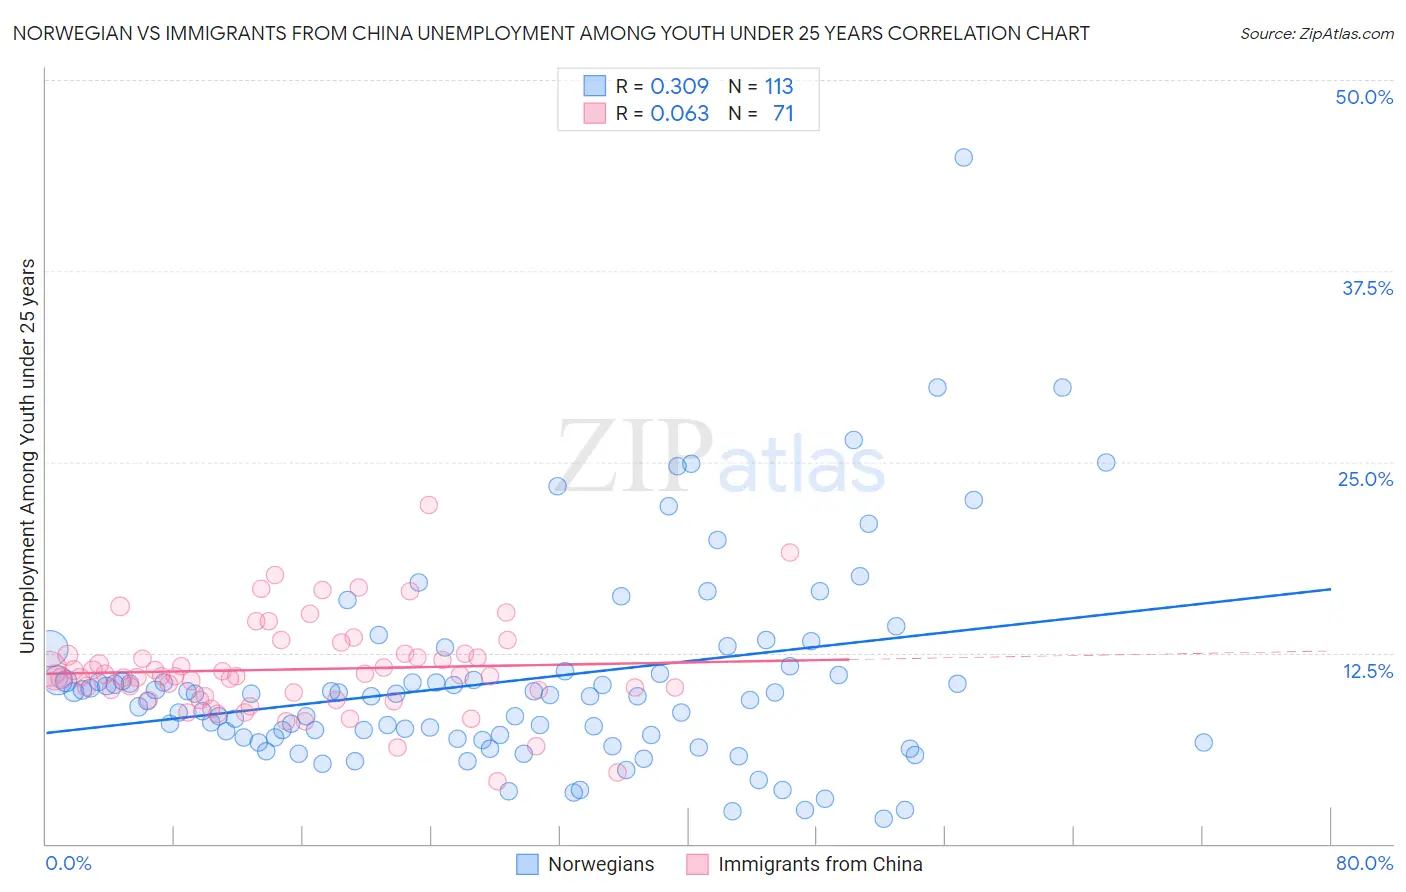
Norwegian vs Immigrants from China Unemployment Among Youth under 25 years Correlation Chart
The statistical analysis conducted on geographies consisting of 514,614,571 people shows a mild positive correlation between the proportion of Norwegians and unemployment rate among youth under the age of 25 in the United States with a correlation coefficient (R) of 0.309 and weighted average of 9.8%. Similarly, the statistical analysis conducted on geographies consisting of 450,048,197 people shows a slight positive correlation between the proportion of Immigrants from China and unemployment rate among youth under the age of 25 in the United States with a correlation coefficient (R) of 0.063 and weighted average of 11.6%, a difference of 17.9%.
Unemployment Among Youth under 25 years Correlation Summary
| Measurement | Norwegian | Immigrants from China |
| Minimum | 1.6% | 4.1% |
| Maximum | 44.9% | 22.2% |
| Range | 43.3% | 18.1% |
| Mean | 10.6% | 11.4% |
| Median | 9.6% | 11.0% |
| Interquartile 25% (IQ1) | 6.9% | 9.7% |
| Interquartile 75% (IQ3) | 11.1% | 12.4% |
| Interquartile Range (IQR) | 4.2% | 2.7% |
| Standard Deviation (Sample) | 6.6% | 3.1% |
| Standard Deviation (Population) | 6.6% | 3.1% |
Similar Demographics by Unemployment Among Youth under 25 years
Demographics Similar to Norwegians by Unemployment Among Youth under 25 years
In terms of unemployment among youth under 25 years, the demographic groups most similar to Norwegians are Immigrants from Cuba (10.0%, a difference of 1.6%), Luxembourger (10.0%, a difference of 1.8%), Zimbabwean (10.2%, a difference of 3.5%), Czech (10.3%, a difference of 4.6%), and Danish (10.3%, a difference of 4.8%).
| Demographics | Rating | Rank | Unemployment Among Youth under 25 years |
| Norwegians | 100.0 /100 | #1 | Exceptional 9.8% |
| Immigrants | Cuba | 100.0 /100 | #2 | Exceptional 10.0% |
| Luxembourgers | 100.0 /100 | #3 | Exceptional 10.0% |
| Zimbabweans | 100.0 /100 | #4 | Exceptional 10.2% |
| Czechs | 100.0 /100 | #5 | Exceptional 10.3% |
| Danes | 100.0 /100 | #6 | Exceptional 10.3% |
| Swedes | 100.0 /100 | #7 | Exceptional 10.4% |
| Immigrants | Venezuela | 100.0 /100 | #8 | Exceptional 10.5% |
| Germans | 100.0 /100 | #9 | Exceptional 10.5% |
| Immigrants | Somalia | 100.0 /100 | #10 | Exceptional 10.5% |
| Scandinavians | 100.0 /100 | #11 | Exceptional 10.5% |
| Immigrants | Sudan | 100.0 /100 | #12 | Exceptional 10.5% |
| Indonesians | 100.0 /100 | #13 | Exceptional 10.6% |
| Cubans | 100.0 /100 | #14 | Exceptional 10.6% |
| Sudanese | 100.0 /100 | #15 | Exceptional 10.6% |
Demographics Similar to Immigrants from China by Unemployment Among Youth under 25 years
In terms of unemployment among youth under 25 years, the demographic groups most similar to Immigrants from China are Immigrants from South Eastern Asia (11.6%, a difference of 0.070%), Immigrants from Iraq (11.6%, a difference of 0.12%), Ugandan (11.6%, a difference of 0.18%), Immigrants from Morocco (11.6%, a difference of 0.21%), and Immigrants from Denmark (11.6%, a difference of 0.21%).
| Demographics | Rating | Rank | Unemployment Among Youth under 25 years |
| Okinawans | 58.7 /100 | #167 | Average 11.6% |
| Potawatomi | 57.9 /100 | #168 | Average 11.6% |
| Eastern Europeans | 57.5 /100 | #169 | Average 11.6% |
| Russians | 57.3 /100 | #170 | Average 11.6% |
| Bangladeshis | 55.6 /100 | #171 | Average 11.6% |
| Immigrants | Morocco | 55.1 /100 | #172 | Average 11.6% |
| Immigrants | South Eastern Asia | 51.7 /100 | #173 | Average 11.6% |
| Immigrants | China | 50.0 /100 | #174 | Average 11.6% |
| Immigrants | Iraq | 47.0 /100 | #175 | Average 11.6% |
| Ugandans | 45.6 /100 | #176 | Average 11.6% |
| Immigrants | Denmark | 45.0 /100 | #177 | Average 11.6% |
| Immigrants | Europe | 42.4 /100 | #178 | Average 11.6% |
| Immigrants | Hong Kong | 42.4 /100 | #179 | Average 11.6% |
| Spaniards | 39.8 /100 | #180 | Fair 11.7% |
| Syrians | 38.4 /100 | #181 | Fair 11.7% |