Spanish American Indian vs Immigrants from Bulgaria Unemployment Among Youth under 25 years
COMPARE
Spanish American Indian
Immigrants from Bulgaria
Unemployment Among Youth under 25 years
Unemployment Among Youth under 25 years Comparison
Spanish American Indians
Immigrants from Bulgaria
13.5%
UNEMPLOYMENT AMONG YOUTH UNDER 25 YEARS
0.0/ 100
METRIC RATING
293rd/ 347
METRIC RANK
11.2%
UNEMPLOYMENT AMONG YOUTH UNDER 25 YEARS
96.4/ 100
METRIC RATING
80th/ 347
METRIC RANK
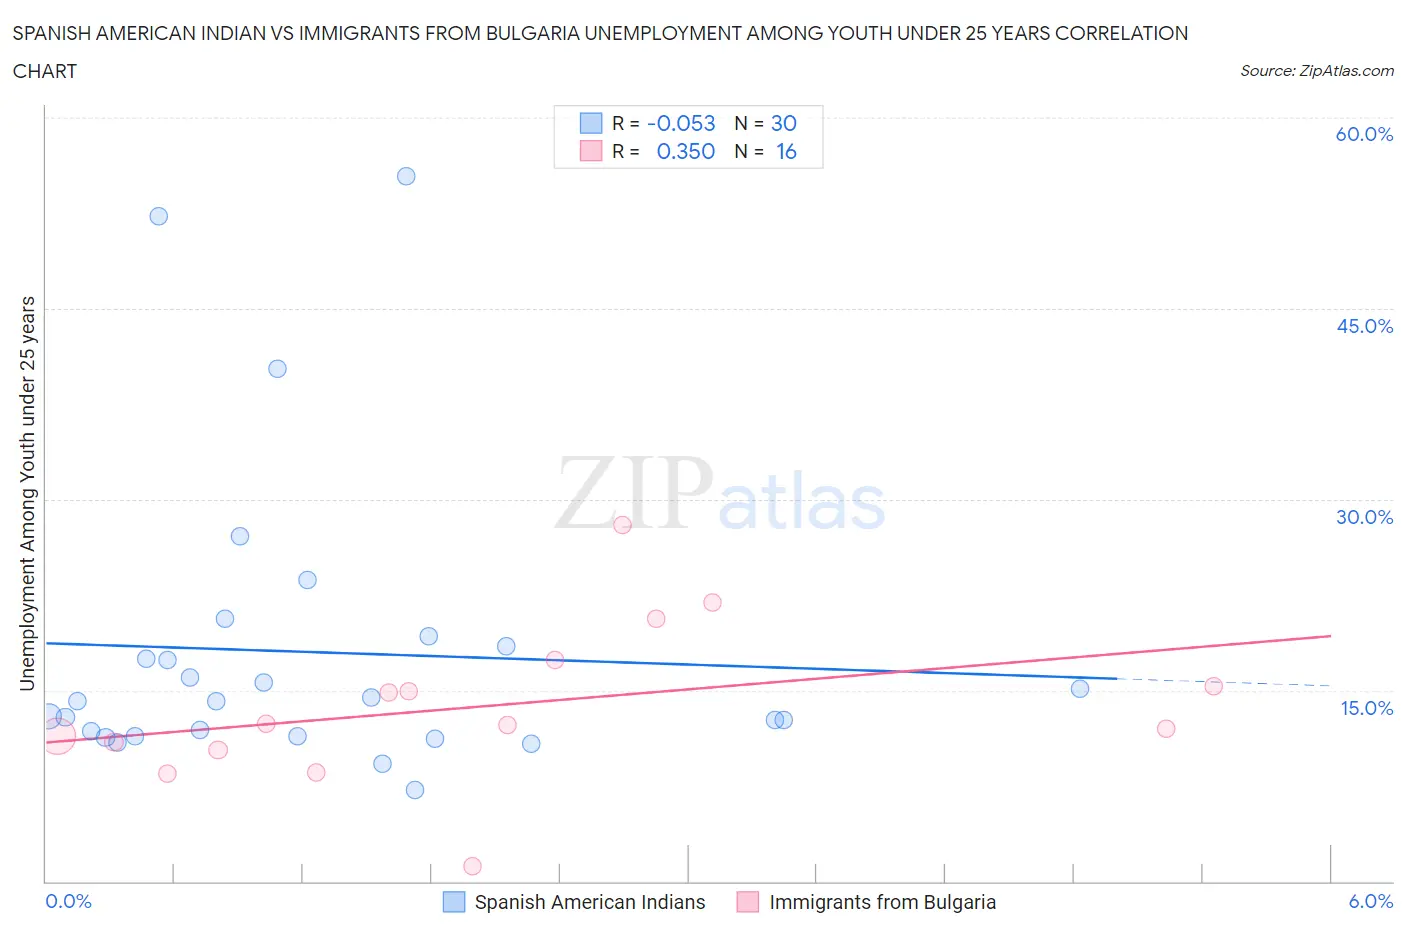
Spanish American Indian vs Immigrants from Bulgaria Unemployment Among Youth under 25 years Correlation Chart
The statistical analysis conducted on geographies consisting of 73,037,062 people shows a slight negative correlation between the proportion of Spanish American Indians and unemployment rate among youth under the age of 25 in the United States with a correlation coefficient (R) of -0.053 and weighted average of 13.5%. Similarly, the statistical analysis conducted on geographies consisting of 171,741,074 people shows a mild positive correlation between the proportion of Immigrants from Bulgaria and unemployment rate among youth under the age of 25 in the United States with a correlation coefficient (R) of 0.350 and weighted average of 11.2%, a difference of 20.2%.
Unemployment Among Youth under 25 years Correlation Summary
| Measurement | Spanish American Indian | Immigrants from Bulgaria |
| Minimum | 7.2% | 1.2% |
| Maximum | 55.4% | 28.0% |
| Range | 48.2% | 26.8% |
| Mean | 18.0% | 13.8% |
| Median | 14.1% | 12.4% |
| Interquartile 25% (IQ1) | 11.4% | 10.6% |
| Interquartile 75% (IQ3) | 18.5% | 16.4% |
| Interquartile Range (IQR) | 7.0% | 5.8% |
| Standard Deviation (Sample) | 11.6% | 6.2% |
| Standard Deviation (Population) | 11.4% | 6.0% |
Similar Demographics by Unemployment Among Youth under 25 years
Demographics Similar to Spanish American Indians by Unemployment Among Youth under 25 years
In terms of unemployment among youth under 25 years, the demographic groups most similar to Spanish American Indians are Central American Indian (13.5%, a difference of 0.11%), Apache (13.5%, a difference of 0.14%), Immigrants from Caribbean (13.5%, a difference of 0.16%), Immigrants from Ecuador (13.4%, a difference of 0.40%), and Chippewa (13.5%, a difference of 0.40%).
| Demographics | Rating | Rank | Unemployment Among Youth under 25 years |
| Blackfeet | 0.0 /100 | #286 | Tragic 13.3% |
| Ecuadorians | 0.0 /100 | #287 | Tragic 13.3% |
| Immigrants | Western Africa | 0.0 /100 | #288 | Tragic 13.4% |
| Immigrants | Ghana | 0.0 /100 | #289 | Tragic 13.4% |
| Immigrants | Ecuador | 0.0 /100 | #290 | Tragic 13.4% |
| Apache | 0.0 /100 | #291 | Tragic 13.5% |
| Central American Indians | 0.0 /100 | #292 | Tragic 13.5% |
| Spanish American Indians | 0.0 /100 | #293 | Tragic 13.5% |
| Immigrants | Caribbean | 0.0 /100 | #294 | Tragic 13.5% |
| Chippewa | 0.0 /100 | #295 | Tragic 13.5% |
| Senegalese | 0.0 /100 | #296 | Tragic 13.5% |
| U.S. Virgin Islanders | 0.0 /100 | #297 | Tragic 13.6% |
| Shoshone | 0.0 /100 | #298 | Tragic 13.7% |
| Tohono O'odham | 0.0 /100 | #299 | Tragic 13.8% |
| Immigrants | Cabo Verde | 0.0 /100 | #300 | Tragic 13.8% |
Demographics Similar to Immigrants from Bulgaria by Unemployment Among Youth under 25 years
In terms of unemployment among youth under 25 years, the demographic groups most similar to Immigrants from Bulgaria are Icelander (11.2%, a difference of 0.050%), Northern European (11.2%, a difference of 0.060%), Immigrants from Canada (11.2%, a difference of 0.080%), Immigrants from Nicaragua (11.2%, a difference of 0.090%), and Bolivian (11.2%, a difference of 0.11%).
| Demographics | Rating | Rank | Unemployment Among Youth under 25 years |
| Creek | 97.2 /100 | #73 | Exceptional 11.2% |
| New Zealanders | 97.2 /100 | #74 | Exceptional 11.2% |
| French | 97.1 /100 | #75 | Exceptional 11.2% |
| German Russians | 97.0 /100 | #76 | Exceptional 11.2% |
| Whites/Caucasians | 96.9 /100 | #77 | Exceptional 11.2% |
| Immigrants | Nicaragua | 96.7 /100 | #78 | Exceptional 11.2% |
| Immigrants | Canada | 96.7 /100 | #79 | Exceptional 11.2% |
| Immigrants | Bulgaria | 96.4 /100 | #80 | Exceptional 11.2% |
| Icelanders | 96.3 /100 | #81 | Exceptional 11.2% |
| Northern Europeans | 96.2 /100 | #82 | Exceptional 11.2% |
| Bolivians | 96.1 /100 | #83 | Exceptional 11.2% |
| French Canadians | 95.9 /100 | #84 | Exceptional 11.2% |
| Immigrants | South Central Asia | 95.9 /100 | #85 | Exceptional 11.2% |
| Immigrants | South Africa | 95.8 /100 | #86 | Exceptional 11.2% |
| Kenyans | 95.7 /100 | #87 | Exceptional 11.2% |