West Indian vs Immigrants from Bulgaria Unemployment Among Youth under 25 years
COMPARE
West Indian
Immigrants from Bulgaria
Unemployment Among Youth under 25 years
Unemployment Among Youth under 25 years Comparison
West Indians
Immigrants from Bulgaria
14.6%
UNEMPLOYMENT AMONG YOUTH UNDER 25 YEARS
0.0/ 100
METRIC RATING
319th/ 347
METRIC RANK
11.2%
UNEMPLOYMENT AMONG YOUTH UNDER 25 YEARS
96.4/ 100
METRIC RATING
80th/ 347
METRIC RANK
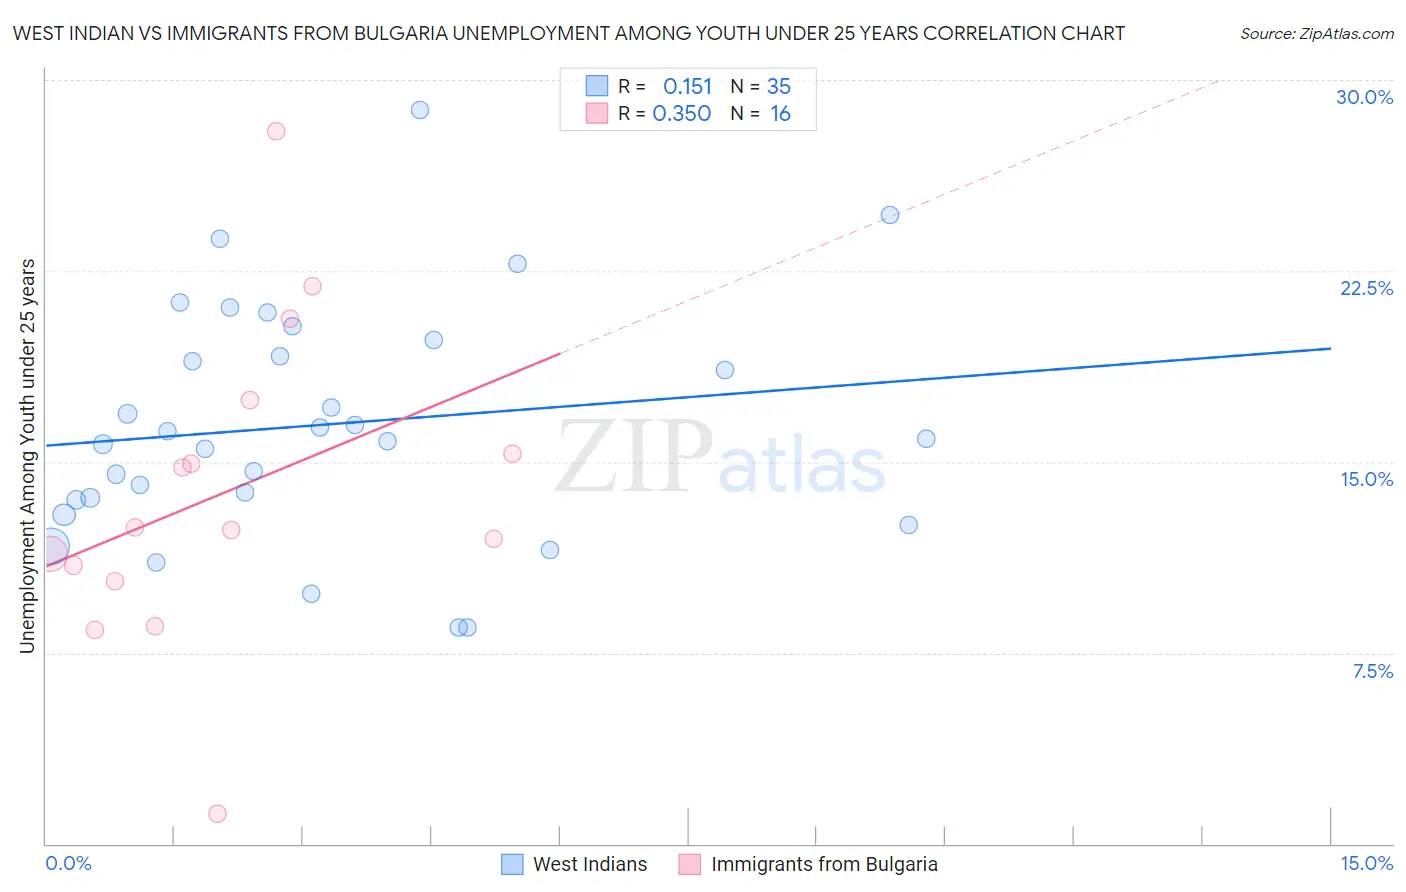
West Indian vs Immigrants from Bulgaria Unemployment Among Youth under 25 years Correlation Chart
The statistical analysis conducted on geographies consisting of 252,611,968 people shows a poor positive correlation between the proportion of West Indians and unemployment rate among youth under the age of 25 in the United States with a correlation coefficient (R) of 0.151 and weighted average of 14.6%. Similarly, the statistical analysis conducted on geographies consisting of 171,741,074 people shows a mild positive correlation between the proportion of Immigrants from Bulgaria and unemployment rate among youth under the age of 25 in the United States with a correlation coefficient (R) of 0.350 and weighted average of 11.2%, a difference of 30.1%.
Unemployment Among Youth under 25 years Correlation Summary
| Measurement | West Indian | Immigrants from Bulgaria |
| Minimum | 8.5% | 1.2% |
| Maximum | 28.8% | 28.0% |
| Range | 20.3% | 26.8% |
| Mean | 16.5% | 13.8% |
| Median | 15.9% | 12.4% |
| Interquartile 25% (IQ1) | 13.5% | 10.6% |
| Interquartile 75% (IQ3) | 19.8% | 16.4% |
| Interquartile Range (IQR) | 6.3% | 5.8% |
| Standard Deviation (Sample) | 4.7% | 6.2% |
| Standard Deviation (Population) | 4.6% | 6.0% |
Similar Demographics by Unemployment Among Youth under 25 years
Demographics Similar to West Indians by Unemployment Among Youth under 25 years
In terms of unemployment among youth under 25 years, the demographic groups most similar to West Indians are Immigrants from Dominica (14.6%, a difference of 0.040%), Barbadian (14.6%, a difference of 0.040%), Cheyenne (14.6%, a difference of 0.20%), Trinidadian and Tobagonian (14.6%, a difference of 0.27%), and Immigrants from Trinidad and Tobago (14.6%, a difference of 0.36%).
| Demographics | Rating | Rank | Unemployment Among Youth under 25 years |
| Vietnamese | 0.0 /100 | #312 | Tragic 14.3% |
| Immigrants | Armenia | 0.0 /100 | #313 | Tragic 14.4% |
| Jamaicans | 0.0 /100 | #314 | Tragic 14.4% |
| Sioux | 0.0 /100 | #315 | Tragic 14.4% |
| Natives/Alaskans | 0.0 /100 | #316 | Tragic 14.5% |
| Blacks/African Americans | 0.0 /100 | #317 | Tragic 14.5% |
| Immigrants | Dominica | 0.0 /100 | #318 | Tragic 14.6% |
| West Indians | 0.0 /100 | #319 | Tragic 14.6% |
| Barbadians | 0.0 /100 | #320 | Tragic 14.6% |
| Cheyenne | 0.0 /100 | #321 | Tragic 14.6% |
| Trinidadians and Tobagonians | 0.0 /100 | #322 | Tragic 14.6% |
| Immigrants | Trinidad and Tobago | 0.0 /100 | #323 | Tragic 14.6% |
| Immigrants | Jamaica | 0.0 /100 | #324 | Tragic 14.8% |
| Alaska Natives | 0.0 /100 | #325 | Tragic 14.9% |
| Immigrants | Barbados | 0.0 /100 | #326 | Tragic 15.2% |
Demographics Similar to Immigrants from Bulgaria by Unemployment Among Youth under 25 years
In terms of unemployment among youth under 25 years, the demographic groups most similar to Immigrants from Bulgaria are Icelander (11.2%, a difference of 0.050%), Northern European (11.2%, a difference of 0.060%), Immigrants from Canada (11.2%, a difference of 0.080%), Immigrants from Nicaragua (11.2%, a difference of 0.090%), and Bolivian (11.2%, a difference of 0.11%).
| Demographics | Rating | Rank | Unemployment Among Youth under 25 years |
| Creek | 97.2 /100 | #73 | Exceptional 11.2% |
| New Zealanders | 97.2 /100 | #74 | Exceptional 11.2% |
| French | 97.1 /100 | #75 | Exceptional 11.2% |
| German Russians | 97.0 /100 | #76 | Exceptional 11.2% |
| Whites/Caucasians | 96.9 /100 | #77 | Exceptional 11.2% |
| Immigrants | Nicaragua | 96.7 /100 | #78 | Exceptional 11.2% |
| Immigrants | Canada | 96.7 /100 | #79 | Exceptional 11.2% |
| Immigrants | Bulgaria | 96.4 /100 | #80 | Exceptional 11.2% |
| Icelanders | 96.3 /100 | #81 | Exceptional 11.2% |
| Northern Europeans | 96.2 /100 | #82 | Exceptional 11.2% |
| Bolivians | 96.1 /100 | #83 | Exceptional 11.2% |
| French Canadians | 95.9 /100 | #84 | Exceptional 11.2% |
| Immigrants | South Central Asia | 95.9 /100 | #85 | Exceptional 11.2% |
| Immigrants | South Africa | 95.8 /100 | #86 | Exceptional 11.2% |
| Kenyans | 95.7 /100 | #87 | Exceptional 11.2% |