Norwegian vs Immigrants from Latin America Unemployment Among Youth under 25 years
COMPARE
Norwegian
Immigrants from Latin America
Unemployment Among Youth under 25 years
Unemployment Among Youth under 25 years Comparison
Norwegians
Immigrants from Latin America
9.8%
UNEMPLOYMENT AMONG YOUTH UNDER 25 YEARS
100.0/ 100
METRIC RATING
1st/ 347
METRIC RANK
12.6%
UNEMPLOYMENT AMONG YOUTH UNDER 25 YEARS
0.0/ 100
METRIC RATING
266th/ 347
METRIC RANK
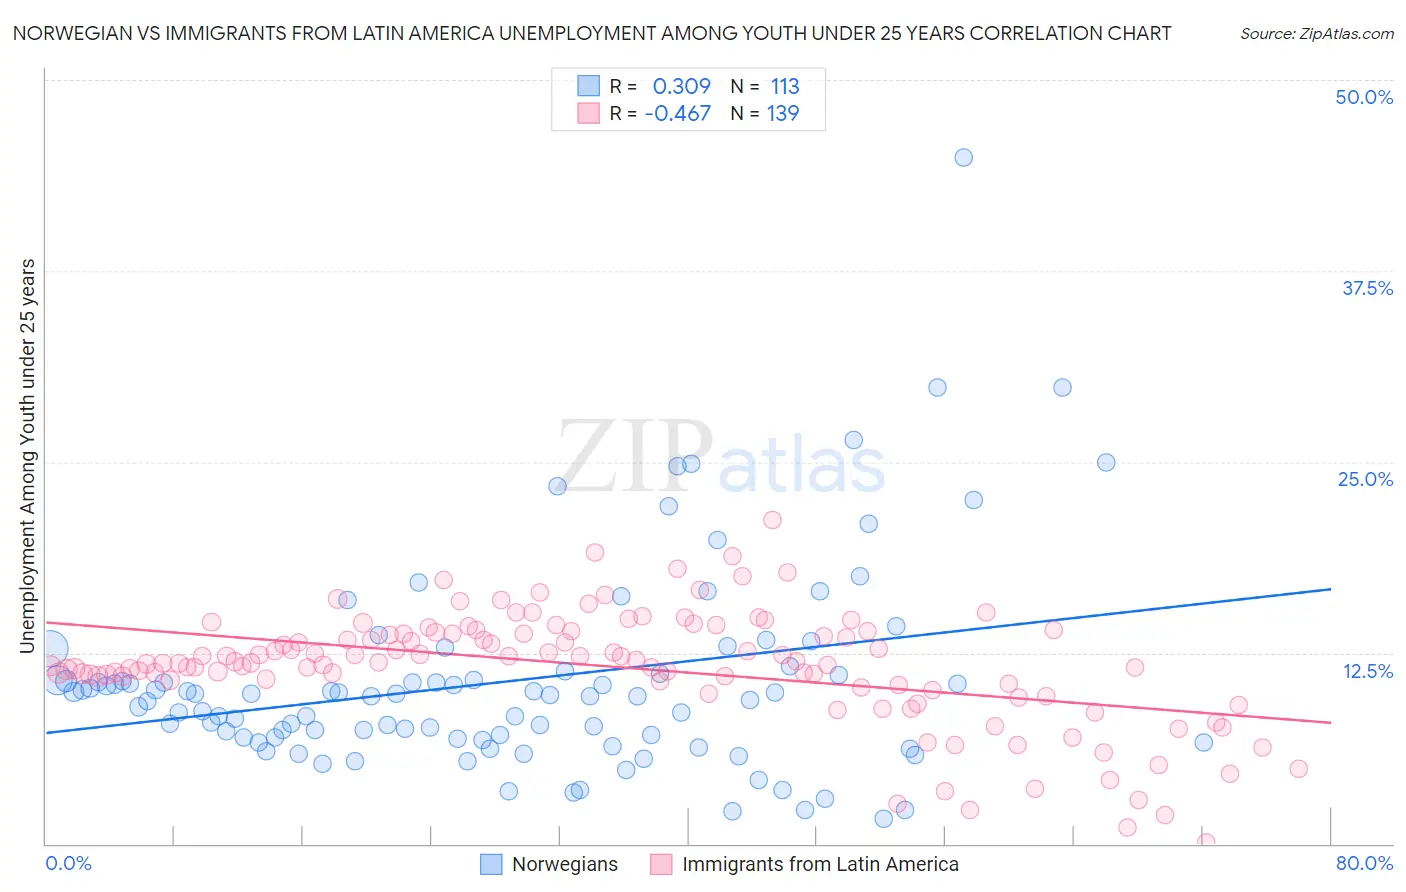
Norwegian vs Immigrants from Latin America Unemployment Among Youth under 25 years Correlation Chart
The statistical analysis conducted on geographies consisting of 514,614,571 people shows a mild positive correlation between the proportion of Norwegians and unemployment rate among youth under the age of 25 in the United States with a correlation coefficient (R) of 0.309 and weighted average of 9.8%. Similarly, the statistical analysis conducted on geographies consisting of 539,396,348 people shows a moderate negative correlation between the proportion of Immigrants from Latin America and unemployment rate among youth under the age of 25 in the United States with a correlation coefficient (R) of -0.467 and weighted average of 12.6%, a difference of 28.3%.
Unemployment Among Youth under 25 years Correlation Summary
| Measurement | Norwegian | Immigrants from Latin America |
| Minimum | 1.6% | 0.10% |
| Maximum | 44.9% | 21.2% |
| Range | 43.3% | 21.1% |
| Mean | 10.6% | 11.6% |
| Median | 9.6% | 11.9% |
| Interquartile 25% (IQ1) | 6.9% | 10.5% |
| Interquartile 75% (IQ3) | 11.1% | 13.9% |
| Interquartile Range (IQR) | 4.2% | 3.4% |
| Standard Deviation (Sample) | 6.6% | 3.7% |
| Standard Deviation (Population) | 6.6% | 3.7% |
Similar Demographics by Unemployment Among Youth under 25 years
Demographics Similar to Norwegians by Unemployment Among Youth under 25 years
In terms of unemployment among youth under 25 years, the demographic groups most similar to Norwegians are Immigrants from Cuba (10.0%, a difference of 1.6%), Luxembourger (10.0%, a difference of 1.8%), Zimbabwean (10.2%, a difference of 3.5%), Czech (10.3%, a difference of 4.6%), and Danish (10.3%, a difference of 4.8%).
| Demographics | Rating | Rank | Unemployment Among Youth under 25 years |
| Norwegians | 100.0 /100 | #1 | Exceptional 9.8% |
| Immigrants | Cuba | 100.0 /100 | #2 | Exceptional 10.0% |
| Luxembourgers | 100.0 /100 | #3 | Exceptional 10.0% |
| Zimbabweans | 100.0 /100 | #4 | Exceptional 10.2% |
| Czechs | 100.0 /100 | #5 | Exceptional 10.3% |
| Danes | 100.0 /100 | #6 | Exceptional 10.3% |
| Swedes | 100.0 /100 | #7 | Exceptional 10.4% |
| Immigrants | Venezuela | 100.0 /100 | #8 | Exceptional 10.5% |
| Germans | 100.0 /100 | #9 | Exceptional 10.5% |
| Immigrants | Somalia | 100.0 /100 | #10 | Exceptional 10.5% |
| Scandinavians | 100.0 /100 | #11 | Exceptional 10.5% |
| Immigrants | Sudan | 100.0 /100 | #12 | Exceptional 10.5% |
| Indonesians | 100.0 /100 | #13 | Exceptional 10.6% |
| Cubans | 100.0 /100 | #14 | Exceptional 10.6% |
| Sudanese | 100.0 /100 | #15 | Exceptional 10.6% |
Demographics Similar to Immigrants from Latin America by Unemployment Among Youth under 25 years
In terms of unemployment among youth under 25 years, the demographic groups most similar to Immigrants from Latin America are Subsaharan African (12.6%, a difference of 0.13%), Tlingit-Haida (12.7%, a difference of 0.21%), Kiowa (12.7%, a difference of 0.34%), Nepalese (12.5%, a difference of 0.90%), and Puget Sound Salish (12.5%, a difference of 1.0%).
| Demographics | Rating | Rank | Unemployment Among Youth under 25 years |
| Immigrants | Central America | 0.1 /100 | #259 | Tragic 12.4% |
| Immigrants | Panama | 0.1 /100 | #260 | Tragic 12.4% |
| Immigrants | El Salvador | 0.1 /100 | #261 | Tragic 12.4% |
| Immigrants | Mexico | 0.1 /100 | #262 | Tragic 12.4% |
| Cree | 0.1 /100 | #263 | Tragic 12.4% |
| Puget Sound Salish | 0.1 /100 | #264 | Tragic 12.5% |
| Nepalese | 0.0 /100 | #265 | Tragic 12.5% |
| Immigrants | Latin America | 0.0 /100 | #266 | Tragic 12.6% |
| Sub-Saharan Africans | 0.0 /100 | #267 | Tragic 12.6% |
| Tlingit-Haida | 0.0 /100 | #268 | Tragic 12.7% |
| Kiowa | 0.0 /100 | #269 | Tragic 12.7% |
| Immigrants | Liberia | 0.0 /100 | #270 | Tragic 12.8% |
| Immigrants | Bahamas | 0.0 /100 | #271 | Tragic 12.9% |
| Cape Verdeans | 0.0 /100 | #272 | Tragic 12.9% |
| Nigerians | 0.0 /100 | #273 | Tragic 13.0% |