Norwegian vs Armenian Unemployment Among Youth under 25 years
COMPARE
Norwegian
Armenian
Unemployment Among Youth under 25 years
Unemployment Among Youth under 25 years Comparison
Norwegians
Armenians
9.8%
UNEMPLOYMENT AMONG YOUTH UNDER 25 YEARS
100.0/ 100
METRIC RATING
1st/ 347
METRIC RANK
13.3%
UNEMPLOYMENT AMONG YOUTH UNDER 25 YEARS
0.0/ 100
METRIC RATING
281st/ 347
METRIC RANK
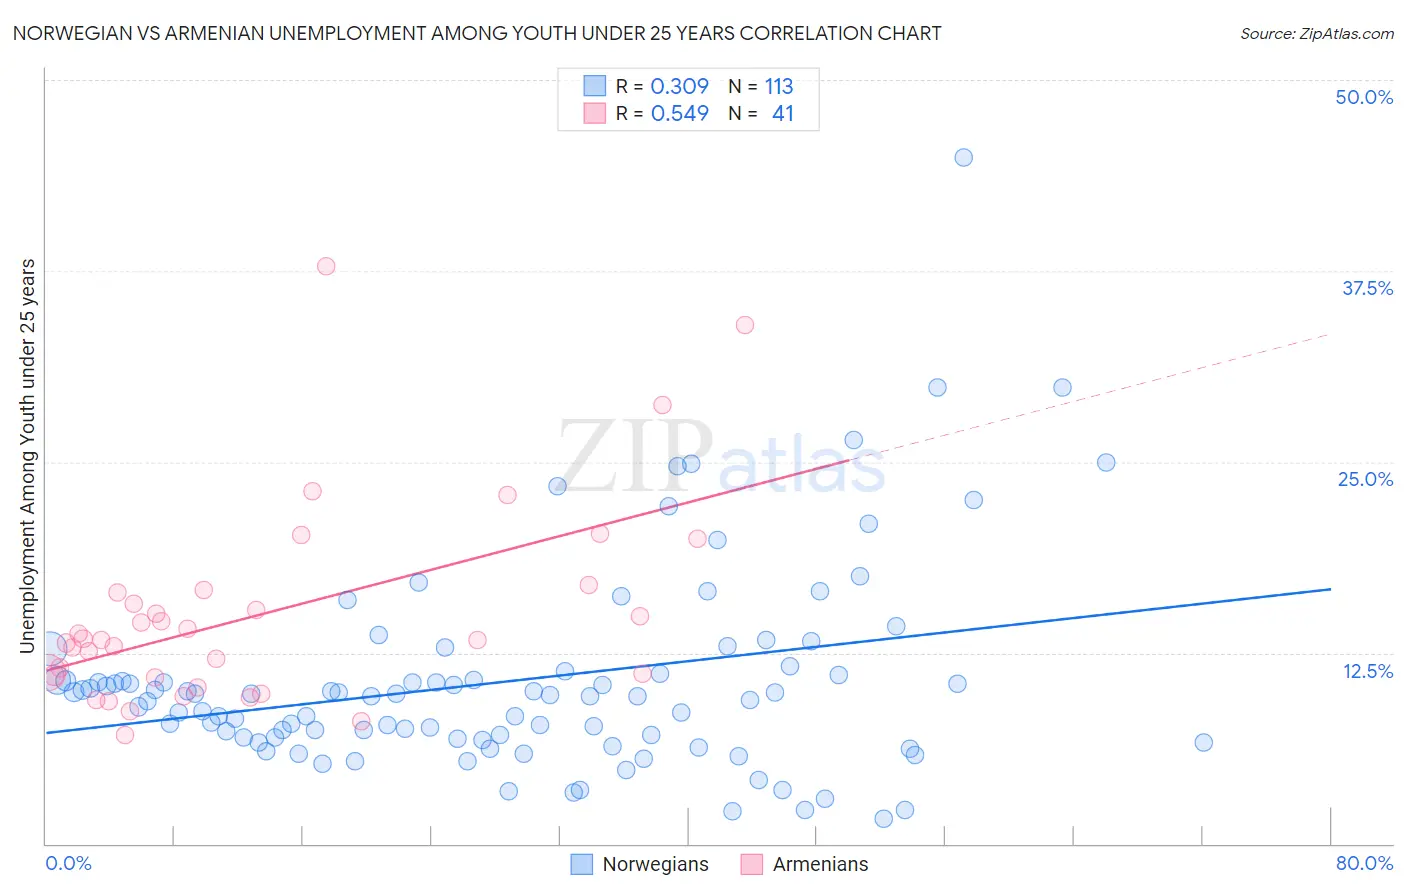
Norwegian vs Armenian Unemployment Among Youth under 25 years Correlation Chart
The statistical analysis conducted on geographies consisting of 514,614,571 people shows a mild positive correlation between the proportion of Norwegians and unemployment rate among youth under the age of 25 in the United States with a correlation coefficient (R) of 0.309 and weighted average of 9.8%. Similarly, the statistical analysis conducted on geographies consisting of 307,706,627 people shows a substantial positive correlation between the proportion of Armenians and unemployment rate among youth under the age of 25 in the United States with a correlation coefficient (R) of 0.549 and weighted average of 13.3%, a difference of 34.9%.
Unemployment Among Youth under 25 years Correlation Summary
| Measurement | Norwegian | Armenian |
| Minimum | 1.6% | 7.1% |
| Maximum | 44.9% | 37.8% |
| Range | 43.3% | 30.7% |
| Mean | 10.6% | 15.0% |
| Median | 9.6% | 13.3% |
| Interquartile 25% (IQ1) | 6.9% | 10.9% |
| Interquartile 75% (IQ3) | 11.1% | 16.5% |
| Interquartile Range (IQR) | 4.2% | 5.6% |
| Standard Deviation (Sample) | 6.6% | 6.6% |
| Standard Deviation (Population) | 6.6% | 6.5% |
Similar Demographics by Unemployment Among Youth under 25 years
Demographics Similar to Norwegians by Unemployment Among Youth under 25 years
In terms of unemployment among youth under 25 years, the demographic groups most similar to Norwegians are Immigrants from Cuba (10.0%, a difference of 1.6%), Luxembourger (10.0%, a difference of 1.8%), Zimbabwean (10.2%, a difference of 3.5%), Czech (10.3%, a difference of 4.6%), and Danish (10.3%, a difference of 4.8%).
| Demographics | Rating | Rank | Unemployment Among Youth under 25 years |
| Norwegians | 100.0 /100 | #1 | Exceptional 9.8% |
| Immigrants | Cuba | 100.0 /100 | #2 | Exceptional 10.0% |
| Luxembourgers | 100.0 /100 | #3 | Exceptional 10.0% |
| Zimbabweans | 100.0 /100 | #4 | Exceptional 10.2% |
| Czechs | 100.0 /100 | #5 | Exceptional 10.3% |
| Danes | 100.0 /100 | #6 | Exceptional 10.3% |
| Swedes | 100.0 /100 | #7 | Exceptional 10.4% |
| Immigrants | Venezuela | 100.0 /100 | #8 | Exceptional 10.5% |
| Germans | 100.0 /100 | #9 | Exceptional 10.5% |
| Immigrants | Somalia | 100.0 /100 | #10 | Exceptional 10.5% |
| Scandinavians | 100.0 /100 | #11 | Exceptional 10.5% |
| Immigrants | Sudan | 100.0 /100 | #12 | Exceptional 10.5% |
| Indonesians | 100.0 /100 | #13 | Exceptional 10.6% |
| Cubans | 100.0 /100 | #14 | Exceptional 10.6% |
| Sudanese | 100.0 /100 | #15 | Exceptional 10.6% |
Demographics Similar to Armenians by Unemployment Among Youth under 25 years
In terms of unemployment among youth under 25 years, the demographic groups most similar to Armenians are Sierra Leonean (13.3%, a difference of 0.010%), Ute (13.3%, a difference of 0.030%), Immigrants from Cameroon (13.3%, a difference of 0.030%), Lumbee (13.3%, a difference of 0.050%), and Ghanaian (13.3%, a difference of 0.13%).
| Demographics | Rating | Rank | Unemployment Among Youth under 25 years |
| Immigrants | Nigeria | 0.0 /100 | #274 | Tragic 13.0% |
| Bermudans | 0.0 /100 | #275 | Tragic 13.0% |
| Immigrants | Uzbekistan | 0.0 /100 | #276 | Tragic 13.1% |
| Bahamians | 0.0 /100 | #277 | Tragic 13.1% |
| Africans | 0.0 /100 | #278 | Tragic 13.2% |
| Cajuns | 0.0 /100 | #279 | Tragic 13.2% |
| Ute | 0.0 /100 | #280 | Tragic 13.3% |
| Armenians | 0.0 /100 | #281 | Tragic 13.3% |
| Sierra Leoneans | 0.0 /100 | #282 | Tragic 13.3% |
| Immigrants | Cameroon | 0.0 /100 | #283 | Tragic 13.3% |
| Lumbee | 0.0 /100 | #284 | Tragic 13.3% |
| Ghanaians | 0.0 /100 | #285 | Tragic 13.3% |
| Blackfeet | 0.0 /100 | #286 | Tragic 13.3% |
| Ecuadorians | 0.0 /100 | #287 | Tragic 13.3% |
| Immigrants | Western Africa | 0.0 /100 | #288 | Tragic 13.4% |