Immigrants from Malaysia vs Guatemalan Unemployment Among Ages 30 to 34 years
COMPARE
Immigrants from Malaysia
Guatemalan
Unemployment Among Ages 30 to 34 years
Unemployment Among Ages 30 to 34 years Comparison
Immigrants from Malaysia
Guatemalans
5.1%
UNEMPLOYMENT AMONG AGES 30 TO 34 YEARS
98.3/ 100
METRIC RATING
49th/ 347
METRIC RANK
6.0%
UNEMPLOYMENT AMONG AGES 30 TO 34 YEARS
0.4/ 100
METRIC RATING
242nd/ 347
METRIC RANK
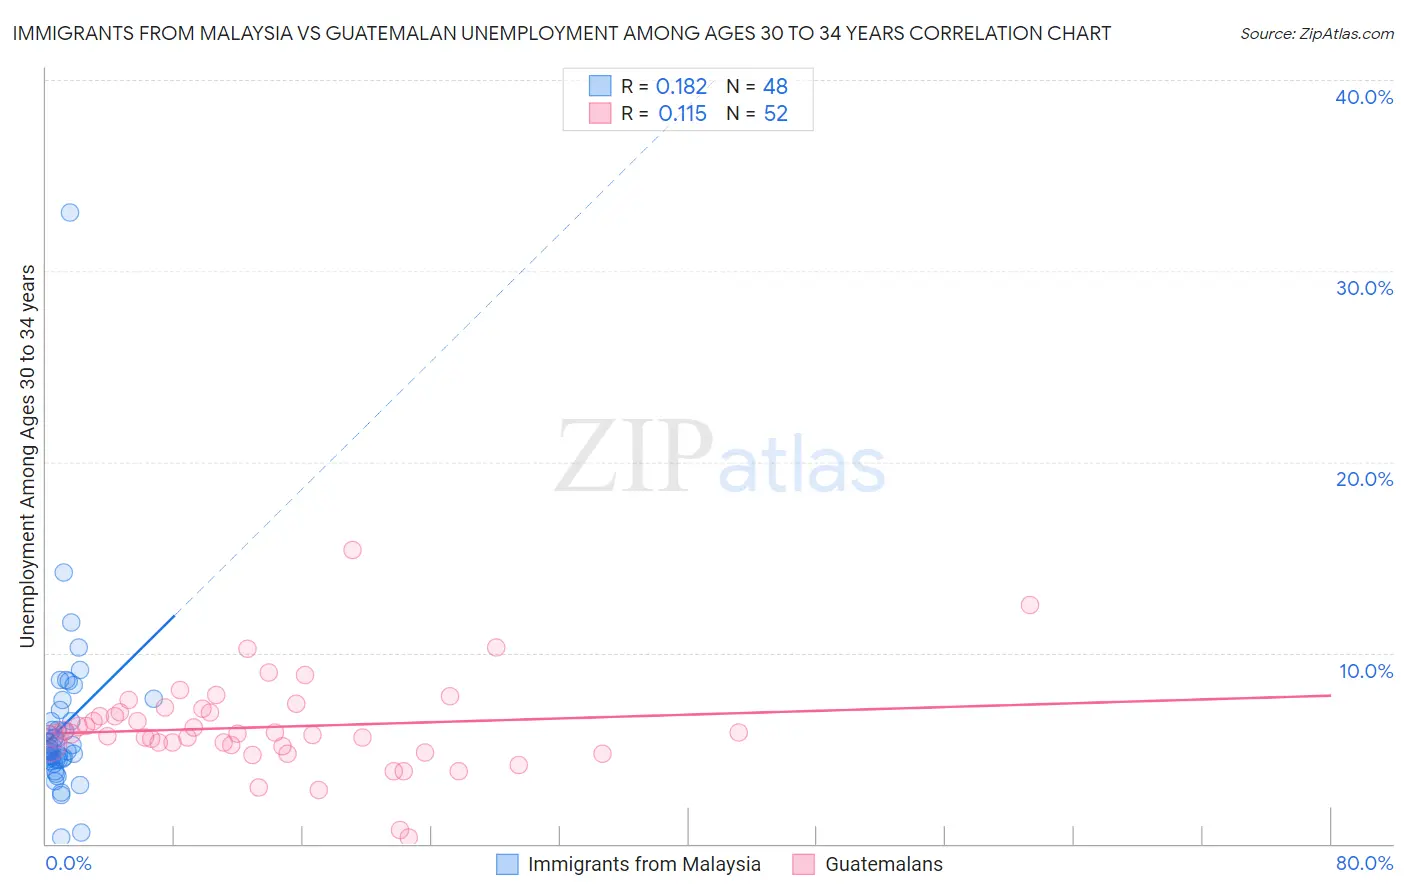
Immigrants from Malaysia vs Guatemalan Unemployment Among Ages 30 to 34 years Correlation Chart
The statistical analysis conducted on geographies consisting of 192,967,482 people shows a poor positive correlation between the proportion of Immigrants from Malaysia and unemployment rate among population between the ages 30 and 34 in the United States with a correlation coefficient (R) of 0.182 and weighted average of 5.1%. Similarly, the statistical analysis conducted on geographies consisting of 387,034,682 people shows a poor positive correlation between the proportion of Guatemalans and unemployment rate among population between the ages 30 and 34 in the United States with a correlation coefficient (R) of 0.115 and weighted average of 6.0%, a difference of 17.9%.
Unemployment Among Ages 30 to 34 years Correlation Summary
| Measurement | Immigrants from Malaysia | Guatemalan |
| Minimum | 0.30% | 0.30% |
| Maximum | 33.1% | 15.4% |
| Range | 32.8% | 15.1% |
| Mean | 6.1% | 6.1% |
| Median | 5.0% | 5.8% |
| Interquartile 25% (IQ1) | 4.4% | 5.1% |
| Interquartile 75% (IQ3) | 6.7% | 7.0% |
| Interquartile Range (IQR) | 2.3% | 1.9% |
| Standard Deviation (Sample) | 4.7% | 2.5% |
| Standard Deviation (Population) | 4.7% | 2.5% |
Similar Demographics by Unemployment Among Ages 30 to 34 years
Demographics Similar to Immigrants from Malaysia by Unemployment Among Ages 30 to 34 years
In terms of unemployment among ages 30 to 34 years, the demographic groups most similar to Immigrants from Malaysia are Puget Sound Salish (5.1%, a difference of 0.080%), Turkish (5.1%, a difference of 0.11%), Assyrian/Chaldean/Syriac (5.1%, a difference of 0.12%), Cypriot (5.1%, a difference of 0.14%), and Immigrants from Burma/Myanmar (5.1%, a difference of 0.14%).
| Demographics | Rating | Rank | Unemployment Among Ages 30 to 34 years |
| Immigrants | Hong Kong | 98.8 /100 | #42 | Exceptional 5.0% |
| Soviet Union | 98.8 /100 | #43 | Exceptional 5.0% |
| Immigrants | Belgium | 98.7 /100 | #44 | Exceptional 5.1% |
| Yugoslavians | 98.6 /100 | #45 | Exceptional 5.1% |
| Immigrants | Congo | 98.4 /100 | #46 | Exceptional 5.1% |
| Cypriots | 98.4 /100 | #47 | Exceptional 5.1% |
| Assyrians/Chaldeans/Syriacs | 98.4 /100 | #48 | Exceptional 5.1% |
| Immigrants | Malaysia | 98.3 /100 | #49 | Exceptional 5.1% |
| Puget Sound Salish | 98.2 /100 | #50 | Exceptional 5.1% |
| Turks | 98.2 /100 | #51 | Exceptional 5.1% |
| Immigrants | Burma/Myanmar | 98.1 /100 | #52 | Exceptional 5.1% |
| Cubans | 98.1 /100 | #53 | Exceptional 5.1% |
| Immigrants | Morocco | 97.9 /100 | #54 | Exceptional 5.1% |
| Chinese | 97.7 /100 | #55 | Exceptional 5.1% |
| Immigrants | Serbia | 97.4 /100 | #56 | Exceptional 5.1% |
Demographics Similar to Guatemalans by Unemployment Among Ages 30 to 34 years
In terms of unemployment among ages 30 to 34 years, the demographic groups most similar to Guatemalans are Immigrants from Liberia (6.0%, a difference of 0.060%), Immigrants from Micronesia (6.0%, a difference of 0.21%), Immigrants from El Salvador (6.0%, a difference of 0.22%), Subsaharan African (6.0%, a difference of 0.23%), and Salvadoran (6.0%, a difference of 0.30%).
| Demographics | Rating | Rank | Unemployment Among Ages 30 to 34 years |
| Yaqui | 0.7 /100 | #235 | Tragic 5.9% |
| Native Hawaiians | 0.7 /100 | #236 | Tragic 5.9% |
| Central Americans | 0.6 /100 | #237 | Tragic 5.9% |
| Mexican American Indians | 0.6 /100 | #238 | Tragic 5.9% |
| Immigrants | Nigeria | 0.6 /100 | #239 | Tragic 6.0% |
| Salvadorans | 0.5 /100 | #240 | Tragic 6.0% |
| Immigrants | El Salvador | 0.5 /100 | #241 | Tragic 6.0% |
| Guatemalans | 0.4 /100 | #242 | Tragic 6.0% |
| Immigrants | Liberia | 0.4 /100 | #243 | Tragic 6.0% |
| Immigrants | Micronesia | 0.3 /100 | #244 | Tragic 6.0% |
| Sub-Saharan Africans | 0.3 /100 | #245 | Tragic 6.0% |
| Ghanaians | 0.3 /100 | #246 | Tragic 6.0% |
| Nigerians | 0.3 /100 | #247 | Tragic 6.0% |
| Immigrants | Guatemala | 0.3 /100 | #248 | Tragic 6.0% |
| Hondurans | 0.3 /100 | #249 | Tragic 6.0% |