Nonimmigrants vs Comanche Unemployment Among Ages 30 to 34 years
COMPARE
Nonimmigrants
Comanche
Unemployment Among Ages 30 to 34 years
Unemployment Among Ages 30 to 34 years Comparison
Nonimmigrants
Comanche
6.1%
UNEMPLOYMENT AMONG AGES 30 TO 34 YEARS
0.2/ 100
METRIC RATING
253rd/ 347
METRIC RANK
6.3%
UNEMPLOYMENT AMONG AGES 30 TO 34 YEARS
0.0/ 100
METRIC RATING
271st/ 347
METRIC RANK
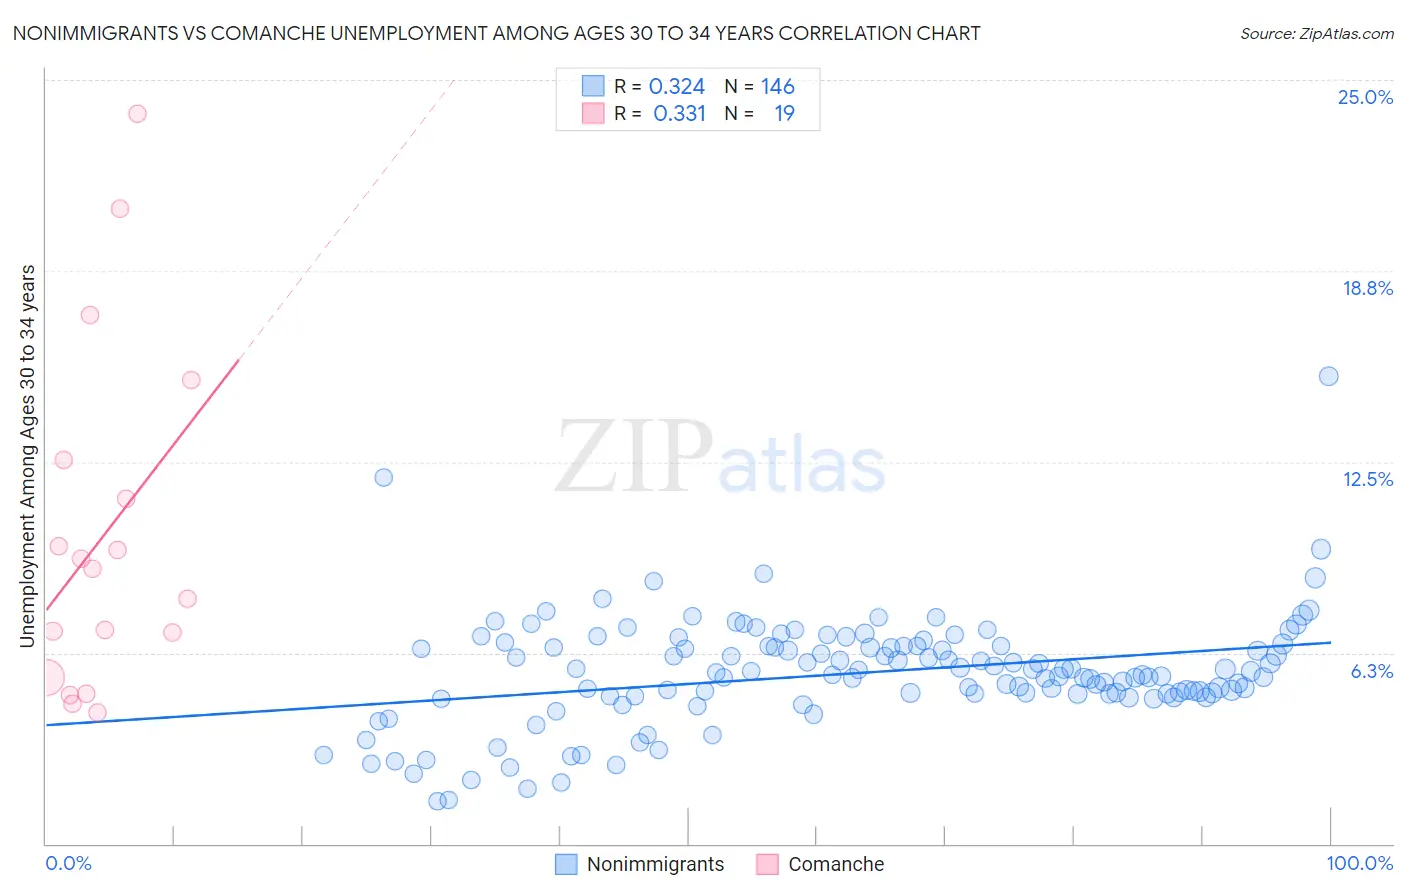
Nonimmigrants vs Comanche Unemployment Among Ages 30 to 34 years Correlation Chart
The statistical analysis conducted on geographies consisting of 505,242,058 people shows a mild positive correlation between the proportion of Nonimmigrants and unemployment rate among population between the ages 30 and 34 in the United States with a correlation coefficient (R) of 0.324 and weighted average of 6.1%. Similarly, the statistical analysis conducted on geographies consisting of 107,264,456 people shows a mild positive correlation between the proportion of Comanche and unemployment rate among population between the ages 30 and 34 in the United States with a correlation coefficient (R) of 0.331 and weighted average of 6.3%, a difference of 3.5%.
Unemployment Among Ages 30 to 34 years Correlation Summary
| Measurement | Nonimmigrants | Comanche |
| Minimum | 1.4% | 4.3% |
| Maximum | 15.3% | 23.9% |
| Range | 13.9% | 19.6% |
| Mean | 5.6% | 10.1% |
| Median | 5.6% | 9.0% |
| Interquartile 25% (IQ1) | 4.9% | 5.4% |
| Interquartile 75% (IQ3) | 6.5% | 12.6% |
| Interquartile Range (IQR) | 1.6% | 7.1% |
| Standard Deviation (Sample) | 1.8% | 5.6% |
| Standard Deviation (Population) | 1.8% | 5.5% |
Demographics Similar to Nonimmigrants and Comanche by Unemployment Among Ages 30 to 34 years
In terms of unemployment among ages 30 to 34 years, the demographic groups most similar to Nonimmigrants are Potawatomi (6.0%, a difference of 0.34%), Armenian (6.1%, a difference of 0.63%), Immigrants from Portugal (6.1%, a difference of 0.94%), Immigrants from Ghana (6.1%, a difference of 1.1%), and Immigrants from Sierra Leone (6.1%, a difference of 1.2%). Similarly, the demographic groups most similar to Comanche are Blackfeet (6.3%, a difference of 0.11%), Immigrants from Senegal (6.3%, a difference of 0.19%), French American Indian (6.3%, a difference of 0.20%), Immigrants from Haiti (6.2%, a difference of 0.50%), and Immigrants from Mexico (6.2%, a difference of 0.66%).
| Demographics | Rating | Rank | Unemployment Among Ages 30 to 34 years |
| Potawatomi | 0.2 /100 | #252 | Tragic 6.0% |
| Immigrants | Nonimmigrants | 0.2 /100 | #253 | Tragic 6.1% |
| Armenians | 0.1 /100 | #254 | Tragic 6.1% |
| Immigrants | Portugal | 0.1 /100 | #255 | Tragic 6.1% |
| Immigrants | Ghana | 0.1 /100 | #256 | Tragic 6.1% |
| Immigrants | Sierra Leone | 0.1 /100 | #257 | Tragic 6.1% |
| Mexicans | 0.1 /100 | #258 | Tragic 6.1% |
| Haitians | 0.1 /100 | #259 | Tragic 6.1% |
| Immigrants | Latin America | 0.1 /100 | #260 | Tragic 6.1% |
| Immigrants | Western Africa | 0.1 /100 | #261 | Tragic 6.2% |
| Immigrants | Central America | 0.1 /100 | #262 | Tragic 6.2% |
| Spanish Americans | 0.0 /100 | #263 | Tragic 6.2% |
| Chickasaw | 0.0 /100 | #264 | Tragic 6.2% |
| Americans | 0.0 /100 | #265 | Tragic 6.2% |
| Seminole | 0.0 /100 | #266 | Tragic 6.2% |
| Immigrants | Mexico | 0.0 /100 | #267 | Tragic 6.2% |
| Immigrants | Haiti | 0.0 /100 | #268 | Tragic 6.2% |
| French American Indians | 0.0 /100 | #269 | Tragic 6.3% |
| Immigrants | Senegal | 0.0 /100 | #270 | Tragic 6.3% |
| Comanche | 0.0 /100 | #271 | Tragic 6.3% |
| Blackfeet | 0.0 /100 | #272 | Tragic 6.3% |