Immigrants from Latin America vs Guatemalan Unemployment Among Ages 30 to 34 years
COMPARE
Immigrants from Latin America
Guatemalan
Unemployment Among Ages 30 to 34 years
Unemployment Among Ages 30 to 34 years Comparison
Immigrants from Latin America
Guatemalans
6.1%
UNEMPLOYMENT AMONG AGES 30 TO 34 YEARS
0.1/ 100
METRIC RATING
260th/ 347
METRIC RANK
6.0%
UNEMPLOYMENT AMONG AGES 30 TO 34 YEARS
0.4/ 100
METRIC RATING
242nd/ 347
METRIC RANK
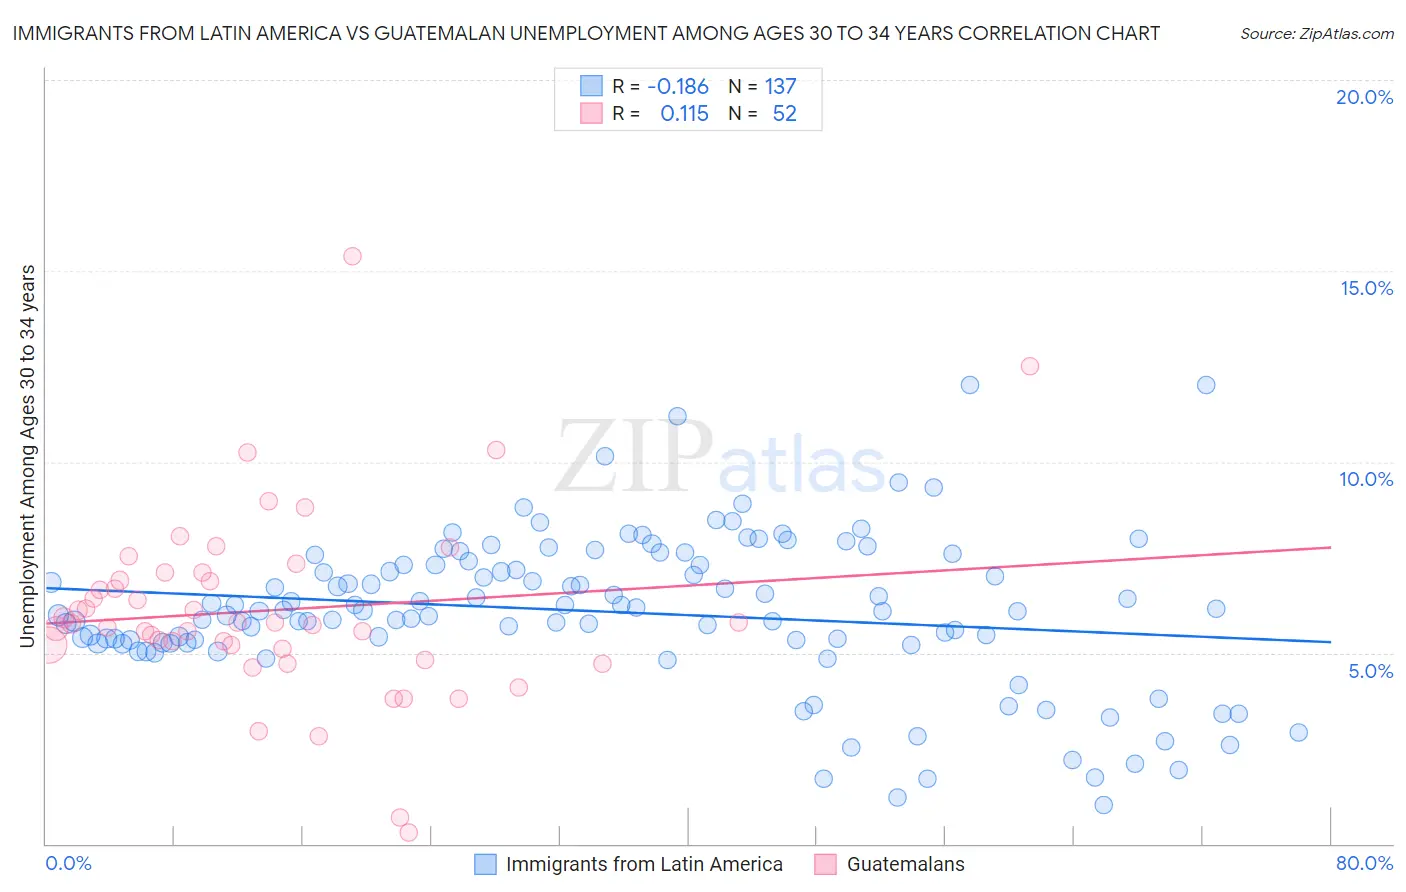
Immigrants from Latin America vs Guatemalan Unemployment Among Ages 30 to 34 years Correlation Chart
The statistical analysis conducted on geographies consisting of 495,403,747 people shows a poor negative correlation between the proportion of Immigrants from Latin America and unemployment rate among population between the ages 30 and 34 in the United States with a correlation coefficient (R) of -0.186 and weighted average of 6.1%. Similarly, the statistical analysis conducted on geographies consisting of 387,034,682 people shows a poor positive correlation between the proportion of Guatemalans and unemployment rate among population between the ages 30 and 34 in the United States with a correlation coefficient (R) of 0.115 and weighted average of 6.0%, a difference of 2.7%.
Unemployment Among Ages 30 to 34 years Correlation Summary
| Measurement | Immigrants from Latin America | Guatemalan |
| Minimum | 1.0% | 0.30% |
| Maximum | 12.0% | 15.4% |
| Range | 11.0% | 15.1% |
| Mean | 6.1% | 6.1% |
| Median | 6.1% | 5.8% |
| Interquartile 25% (IQ1) | 5.3% | 5.1% |
| Interquartile 75% (IQ3) | 7.3% | 7.0% |
| Interquartile Range (IQR) | 2.0% | 1.9% |
| Standard Deviation (Sample) | 2.0% | 2.5% |
| Standard Deviation (Population) | 2.0% | 2.5% |
Demographics Similar to Immigrants from Latin America and Guatemalans by Unemployment Among Ages 30 to 34 years
In terms of unemployment among ages 30 to 34 years, the demographic groups most similar to Immigrants from Latin America are Immigrants from Western Africa (6.2%, a difference of 0.15%), Haitian (6.1%, a difference of 0.22%), Mexican (6.1%, a difference of 0.30%), Immigrants from Sierra Leone (6.1%, a difference of 0.36%), and Immigrants from Ghana (6.1%, a difference of 0.40%). Similarly, the demographic groups most similar to Guatemalans are Immigrants from Liberia (6.0%, a difference of 0.060%), Immigrants from Micronesia (6.0%, a difference of 0.21%), Immigrants from El Salvador (6.0%, a difference of 0.22%), Subsaharan African (6.0%, a difference of 0.23%), and Ghanaian (6.0%, a difference of 0.42%).
| Demographics | Rating | Rank | Unemployment Among Ages 30 to 34 years |
| Immigrants | El Salvador | 0.5 /100 | #241 | Tragic 6.0% |
| Guatemalans | 0.4 /100 | #242 | Tragic 6.0% |
| Immigrants | Liberia | 0.4 /100 | #243 | Tragic 6.0% |
| Immigrants | Micronesia | 0.3 /100 | #244 | Tragic 6.0% |
| Sub-Saharan Africans | 0.3 /100 | #245 | Tragic 6.0% |
| Ghanaians | 0.3 /100 | #246 | Tragic 6.0% |
| Nigerians | 0.3 /100 | #247 | Tragic 6.0% |
| Immigrants | Guatemala | 0.3 /100 | #248 | Tragic 6.0% |
| Hondurans | 0.3 /100 | #249 | Tragic 6.0% |
| Immigrants | Honduras | 0.3 /100 | #250 | Tragic 6.0% |
| Tlingit-Haida | 0.2 /100 | #251 | Tragic 6.0% |
| Potawatomi | 0.2 /100 | #252 | Tragic 6.0% |
| Immigrants | Nonimmigrants | 0.2 /100 | #253 | Tragic 6.1% |
| Armenians | 0.1 /100 | #254 | Tragic 6.1% |
| Immigrants | Portugal | 0.1 /100 | #255 | Tragic 6.1% |
| Immigrants | Ghana | 0.1 /100 | #256 | Tragic 6.1% |
| Immigrants | Sierra Leone | 0.1 /100 | #257 | Tragic 6.1% |
| Mexicans | 0.1 /100 | #258 | Tragic 6.1% |
| Haitians | 0.1 /100 | #259 | Tragic 6.1% |
| Immigrants | Latin America | 0.1 /100 | #260 | Tragic 6.1% |
| Immigrants | Western Africa | 0.1 /100 | #261 | Tragic 6.2% |