Nigerian vs Jordanian Unemployment Among Women with Children Ages 6 to 17 years
COMPARE
Nigerian
Jordanian
Unemployment Among Women with Children Ages 6 to 17 years
Unemployment Among Women with Children Ages 6 to 17 years Comparison
Nigerians
Jordanians
10.1%
UNEMPLOYMENT AMONG WOMEN WITH CHILDREN AGES 6 TO 17 YEARS
0.0/ 100
METRIC RATING
300th/ 347
METRIC RANK
9.0%
UNEMPLOYMENT AMONG WOMEN WITH CHILDREN AGES 6 TO 17 YEARS
52.2/ 100
METRIC RATING
171st/ 347
METRIC RANK
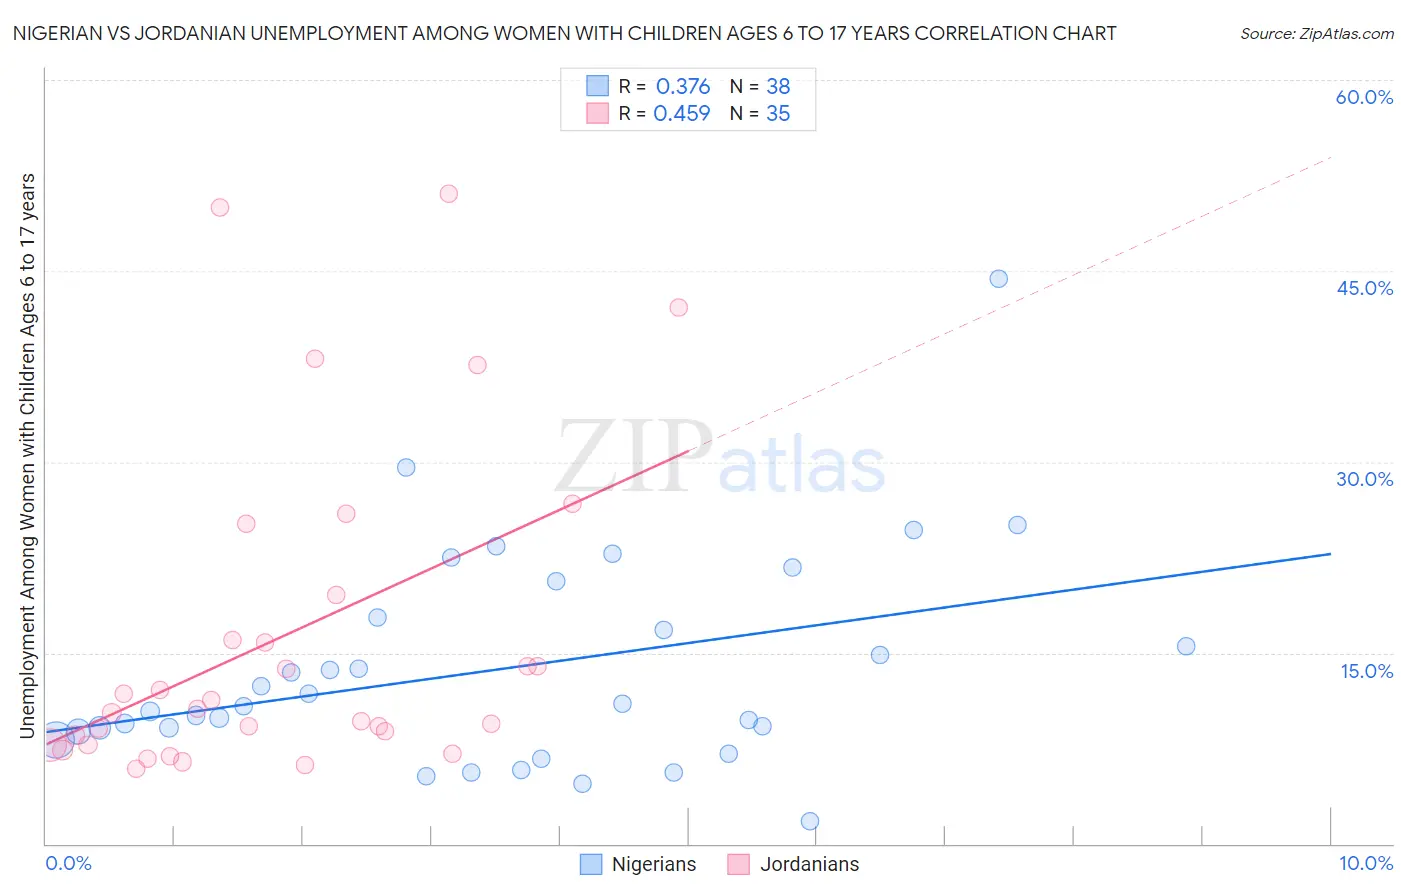
Nigerian vs Jordanian Unemployment Among Women with Children Ages 6 to 17 years Correlation Chart
The statistical analysis conducted on geographies consisting of 257,309,960 people shows a mild positive correlation between the proportion of Nigerians and unemployment rate among women with children between the ages 6 and 17 in the United States with a correlation coefficient (R) of 0.376 and weighted average of 10.1%. Similarly, the statistical analysis conducted on geographies consisting of 139,824,688 people shows a moderate positive correlation between the proportion of Jordanians and unemployment rate among women with children between the ages 6 and 17 in the United States with a correlation coefficient (R) of 0.459 and weighted average of 9.0%, a difference of 12.8%.
Unemployment Among Women with Children Ages 6 to 17 years Correlation Summary
| Measurement | Nigerian | Jordanian |
| Minimum | 1.8% | 5.9% |
| Maximum | 44.4% | 51.1% |
| Range | 42.6% | 45.2% |
| Mean | 13.8% | 16.3% |
| Median | 10.9% | 10.6% |
| Interquartile 25% (IQ1) | 8.8% | 7.8% |
| Interquartile 75% (IQ3) | 17.8% | 19.5% |
| Interquartile Range (IQR) | 9.0% | 11.7% |
| Standard Deviation (Sample) | 8.4% | 12.8% |
| Standard Deviation (Population) | 8.3% | 12.6% |
Similar Demographics by Unemployment Among Women with Children Ages 6 to 17 years
Demographics Similar to Nigerians by Unemployment Among Women with Children Ages 6 to 17 years
In terms of unemployment among women with children ages 6 to 17 years, the demographic groups most similar to Nigerians are Immigrants from Honduras (10.1%, a difference of 0.020%), Immigrants from Haiti (10.1%, a difference of 0.040%), Immigrants from Bahamas (10.1%, a difference of 0.15%), Immigrants from Caribbean (10.1%, a difference of 0.34%), and Immigrants from Western Africa (10.1%, a difference of 0.36%).
| Demographics | Rating | Rank | Unemployment Among Women with Children Ages 6 to 17 years |
| Haitians | 0.0 /100 | #293 | Tragic 10.0% |
| Ecuadorians | 0.0 /100 | #294 | Tragic 10.0% |
| Cherokee | 0.0 /100 | #295 | Tragic 10.0% |
| Immigrants | Western Africa | 0.0 /100 | #296 | Tragic 10.1% |
| Immigrants | Caribbean | 0.0 /100 | #297 | Tragic 10.1% |
| Immigrants | Haiti | 0.0 /100 | #298 | Tragic 10.1% |
| Immigrants | Honduras | 0.0 /100 | #299 | Tragic 10.1% |
| Nigerians | 0.0 /100 | #300 | Tragic 10.1% |
| Immigrants | Bahamas | 0.0 /100 | #301 | Tragic 10.1% |
| Venezuelans | 0.0 /100 | #302 | Tragic 10.2% |
| Immigrants | Ecuador | 0.0 /100 | #303 | Tragic 10.2% |
| Immigrants | Venezuela | 0.0 /100 | #304 | Tragic 10.2% |
| Immigrants | Nigeria | 0.0 /100 | #305 | Tragic 10.2% |
| Paraguayans | 0.0 /100 | #306 | Tragic 10.2% |
| Immigrants | Senegal | 0.0 /100 | #307 | Tragic 10.2% |
Demographics Similar to Jordanians by Unemployment Among Women with Children Ages 6 to 17 years
In terms of unemployment among women with children ages 6 to 17 years, the demographic groups most similar to Jordanians are Immigrants from West Indies (9.0%, a difference of 0.0%), Immigrants from Brazil (9.0%, a difference of 0.050%), Turkish (8.9%, a difference of 0.090%), Immigrants from Costa Rica (9.0%, a difference of 0.10%), and British (8.9%, a difference of 0.14%).
| Demographics | Rating | Rank | Unemployment Among Women with Children Ages 6 to 17 years |
| Ukrainians | 59.7 /100 | #164 | Average 8.9% |
| Immigrants | Micronesia | 59.2 /100 | #165 | Average 8.9% |
| Moroccans | 58.3 /100 | #166 | Average 8.9% |
| Immigrants | England | 57.7 /100 | #167 | Average 8.9% |
| Immigrants | Croatia | 57.1 /100 | #168 | Average 8.9% |
| British | 55.2 /100 | #169 | Average 8.9% |
| Turks | 54.1 /100 | #170 | Average 8.9% |
| Jordanians | 52.2 /100 | #171 | Average 9.0% |
| Immigrants | West Indies | 52.2 /100 | #172 | Average 9.0% |
| Immigrants | Brazil | 51.0 /100 | #173 | Average 9.0% |
| Immigrants | Costa Rica | 50.0 /100 | #174 | Average 9.0% |
| Immigrants | Sierra Leone | 45.9 /100 | #175 | Average 9.0% |
| Immigrants | Italy | 43.7 /100 | #176 | Average 9.0% |
| Immigrants | Jordan | 41.6 /100 | #177 | Average 9.0% |
| Menominee | 39.3 /100 | #178 | Fair 9.0% |