Nigerian vs Costa Rican Unemployment Among Women with Children Ages 6 to 17 years
COMPARE
Nigerian
Costa Rican
Unemployment Among Women with Children Ages 6 to 17 years
Unemployment Among Women with Children Ages 6 to 17 years Comparison
Nigerians
Costa Ricans
10.1%
UNEMPLOYMENT AMONG WOMEN WITH CHILDREN AGES 6 TO 17 YEARS
0.0/ 100
METRIC RATING
300th/ 347
METRIC RANK
8.8%
UNEMPLOYMENT AMONG WOMEN WITH CHILDREN AGES 6 TO 17 YEARS
77.0/ 100
METRIC RATING
148th/ 347
METRIC RANK
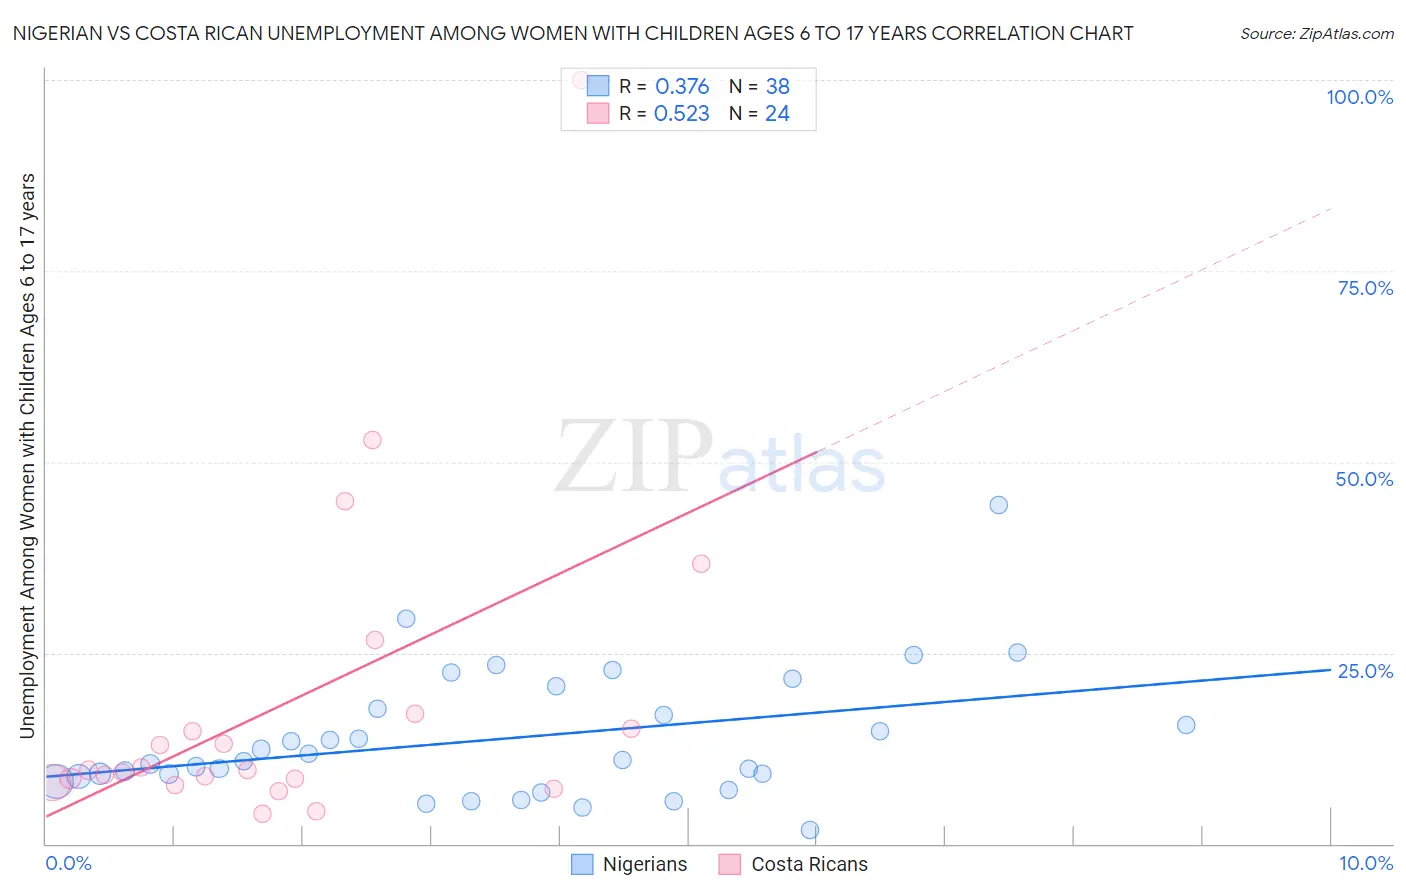
Nigerian vs Costa Rican Unemployment Among Women with Children Ages 6 to 17 years Correlation Chart
The statistical analysis conducted on geographies consisting of 257,309,960 people shows a mild positive correlation between the proportion of Nigerians and unemployment rate among women with children between the ages 6 and 17 in the United States with a correlation coefficient (R) of 0.376 and weighted average of 10.1%. Similarly, the statistical analysis conducted on geographies consisting of 200,264,752 people shows a substantial positive correlation between the proportion of Costa Ricans and unemployment rate among women with children between the ages 6 and 17 in the United States with a correlation coefficient (R) of 0.523 and weighted average of 8.8%, a difference of 14.2%.
Unemployment Among Women with Children Ages 6 to 17 years Correlation Summary
| Measurement | Nigerian | Costa Rican |
| Minimum | 1.8% | 3.8% |
| Maximum | 44.4% | 100.0% |
| Range | 42.6% | 96.2% |
| Mean | 13.8% | 18.5% |
| Median | 10.9% | 9.6% |
| Interquartile 25% (IQ1) | 8.8% | 8.3% |
| Interquartile 75% (IQ3) | 17.8% | 16.0% |
| Interquartile Range (IQR) | 9.0% | 7.7% |
| Standard Deviation (Sample) | 8.4% | 21.5% |
| Standard Deviation (Population) | 8.3% | 21.0% |
Similar Demographics by Unemployment Among Women with Children Ages 6 to 17 years
Demographics Similar to Nigerians by Unemployment Among Women with Children Ages 6 to 17 years
In terms of unemployment among women with children ages 6 to 17 years, the demographic groups most similar to Nigerians are Immigrants from Honduras (10.1%, a difference of 0.020%), Immigrants from Haiti (10.1%, a difference of 0.040%), Immigrants from Bahamas (10.1%, a difference of 0.15%), Immigrants from Caribbean (10.1%, a difference of 0.34%), and Immigrants from Western Africa (10.1%, a difference of 0.36%).
| Demographics | Rating | Rank | Unemployment Among Women with Children Ages 6 to 17 years |
| Haitians | 0.0 /100 | #293 | Tragic 10.0% |
| Ecuadorians | 0.0 /100 | #294 | Tragic 10.0% |
| Cherokee | 0.0 /100 | #295 | Tragic 10.0% |
| Immigrants | Western Africa | 0.0 /100 | #296 | Tragic 10.1% |
| Immigrants | Caribbean | 0.0 /100 | #297 | Tragic 10.1% |
| Immigrants | Haiti | 0.0 /100 | #298 | Tragic 10.1% |
| Immigrants | Honduras | 0.0 /100 | #299 | Tragic 10.1% |
| Nigerians | 0.0 /100 | #300 | Tragic 10.1% |
| Immigrants | Bahamas | 0.0 /100 | #301 | Tragic 10.1% |
| Venezuelans | 0.0 /100 | #302 | Tragic 10.2% |
| Immigrants | Ecuador | 0.0 /100 | #303 | Tragic 10.2% |
| Immigrants | Venezuela | 0.0 /100 | #304 | Tragic 10.2% |
| Immigrants | Nigeria | 0.0 /100 | #305 | Tragic 10.2% |
| Paraguayans | 0.0 /100 | #306 | Tragic 10.2% |
| Immigrants | Senegal | 0.0 /100 | #307 | Tragic 10.2% |
Demographics Similar to Costa Ricans by Unemployment Among Women with Children Ages 6 to 17 years
In terms of unemployment among women with children ages 6 to 17 years, the demographic groups most similar to Costa Ricans are Croatian (8.8%, a difference of 0.060%), Greek (8.9%, a difference of 0.11%), Immigrants from Eastern Africa (8.9%, a difference of 0.15%), Immigrants from Northern Europe (8.9%, a difference of 0.15%), and Immigrants from Bangladesh (8.8%, a difference of 0.16%).
| Demographics | Rating | Rank | Unemployment Among Women with Children Ages 6 to 17 years |
| Serbians | 87.6 /100 | #141 | Excellent 8.8% |
| Immigrants | Austria | 87.5 /100 | #142 | Excellent 8.8% |
| Immigrants | Kenya | 86.1 /100 | #143 | Excellent 8.8% |
| Russians | 85.8 /100 | #144 | Excellent 8.8% |
| Kenyans | 85.6 /100 | #145 | Excellent 8.8% |
| Chileans | 80.8 /100 | #146 | Excellent 8.8% |
| Immigrants | Bangladesh | 79.4 /100 | #147 | Good 8.8% |
| Costa Ricans | 77.0 /100 | #148 | Good 8.8% |
| Croatians | 76.0 /100 | #149 | Good 8.8% |
| Greeks | 75.2 /100 | #150 | Good 8.9% |
| Immigrants | Eastern Africa | 74.6 /100 | #151 | Good 8.9% |
| Immigrants | Northern Europe | 74.6 /100 | #152 | Good 8.9% |
| Immigrants | Europe | 73.4 /100 | #153 | Good 8.9% |
| Vietnamese | 72.1 /100 | #154 | Good 8.9% |
| Immigrants | Greece | 71.8 /100 | #155 | Good 8.9% |