Nigerian vs West Indian Unemployment Among Women with Children Ages 6 to 17 years
COMPARE
Nigerian
West Indian
Unemployment Among Women with Children Ages 6 to 17 years
Unemployment Among Women with Children Ages 6 to 17 years Comparison
Nigerians
West Indians
10.1%
UNEMPLOYMENT AMONG WOMEN WITH CHILDREN AGES 6 TO 17 YEARS
0.0/ 100
METRIC RATING
300th/ 347
METRIC RANK
9.5%
UNEMPLOYMENT AMONG WOMEN WITH CHILDREN AGES 6 TO 17 YEARS
0.4/ 100
METRIC RATING
265th/ 347
METRIC RANK
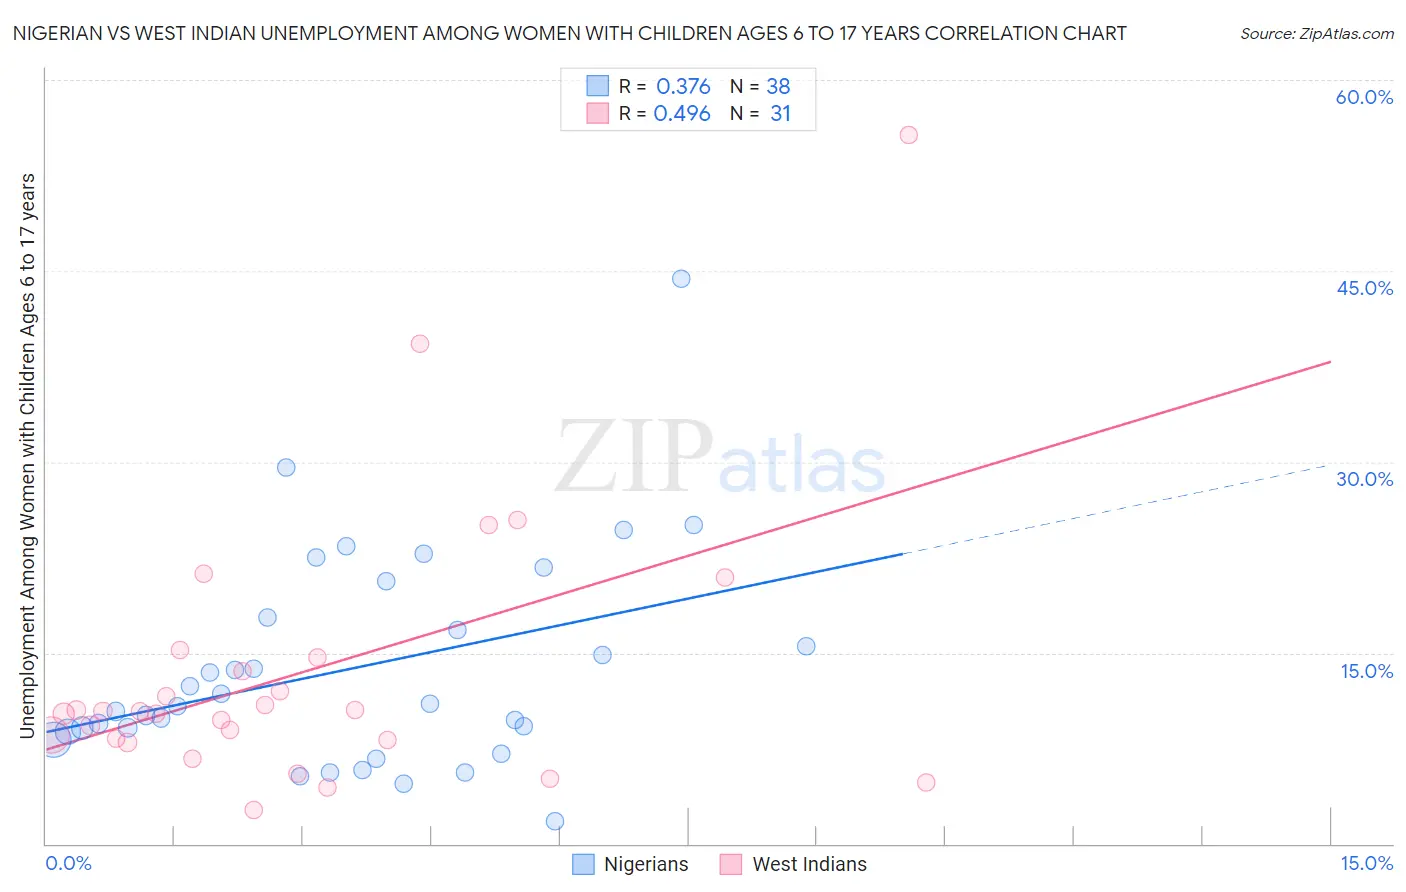
Nigerian vs West Indian Unemployment Among Women with Children Ages 6 to 17 years Correlation Chart
The statistical analysis conducted on geographies consisting of 257,309,960 people shows a mild positive correlation between the proportion of Nigerians and unemployment rate among women with children between the ages 6 and 17 in the United States with a correlation coefficient (R) of 0.376 and weighted average of 10.1%. Similarly, the statistical analysis conducted on geographies consisting of 202,380,945 people shows a moderate positive correlation between the proportion of West Indians and unemployment rate among women with children between the ages 6 and 17 in the United States with a correlation coefficient (R) of 0.496 and weighted average of 9.5%, a difference of 6.1%.
Unemployment Among Women with Children Ages 6 to 17 years Correlation Summary
| Measurement | Nigerian | West Indian |
| Minimum | 1.8% | 2.7% |
| Maximum | 44.4% | 55.7% |
| Range | 42.6% | 53.0% |
| Mean | 13.8% | 13.5% |
| Median | 10.9% | 10.4% |
| Interquartile 25% (IQ1) | 8.8% | 8.2% |
| Interquartile 75% (IQ3) | 17.8% | 14.6% |
| Interquartile Range (IQR) | 9.0% | 6.4% |
| Standard Deviation (Sample) | 8.4% | 10.8% |
| Standard Deviation (Population) | 8.3% | 10.7% |
Similar Demographics by Unemployment Among Women with Children Ages 6 to 17 years
Demographics Similar to Nigerians by Unemployment Among Women with Children Ages 6 to 17 years
In terms of unemployment among women with children ages 6 to 17 years, the demographic groups most similar to Nigerians are Immigrants from Honduras (10.1%, a difference of 0.020%), Immigrants from Haiti (10.1%, a difference of 0.040%), Immigrants from Bahamas (10.1%, a difference of 0.15%), Immigrants from Caribbean (10.1%, a difference of 0.34%), and Immigrants from Western Africa (10.1%, a difference of 0.36%).
| Demographics | Rating | Rank | Unemployment Among Women with Children Ages 6 to 17 years |
| Haitians | 0.0 /100 | #293 | Tragic 10.0% |
| Ecuadorians | 0.0 /100 | #294 | Tragic 10.0% |
| Cherokee | 0.0 /100 | #295 | Tragic 10.0% |
| Immigrants | Western Africa | 0.0 /100 | #296 | Tragic 10.1% |
| Immigrants | Caribbean | 0.0 /100 | #297 | Tragic 10.1% |
| Immigrants | Haiti | 0.0 /100 | #298 | Tragic 10.1% |
| Immigrants | Honduras | 0.0 /100 | #299 | Tragic 10.1% |
| Nigerians | 0.0 /100 | #300 | Tragic 10.1% |
| Immigrants | Bahamas | 0.0 /100 | #301 | Tragic 10.1% |
| Venezuelans | 0.0 /100 | #302 | Tragic 10.2% |
| Immigrants | Ecuador | 0.0 /100 | #303 | Tragic 10.2% |
| Immigrants | Venezuela | 0.0 /100 | #304 | Tragic 10.2% |
| Immigrants | Nigeria | 0.0 /100 | #305 | Tragic 10.2% |
| Paraguayans | 0.0 /100 | #306 | Tragic 10.2% |
| Immigrants | Senegal | 0.0 /100 | #307 | Tragic 10.2% |
Demographics Similar to West Indians by Unemployment Among Women with Children Ages 6 to 17 years
In terms of unemployment among women with children ages 6 to 17 years, the demographic groups most similar to West Indians are Immigrants from Ghana (9.5%, a difference of 0.030%), Immigrants from Jamaica (9.5%, a difference of 0.16%), Irish (9.5%, a difference of 0.18%), Lebanese (9.5%, a difference of 0.27%), and Senegalese (9.5%, a difference of 0.31%).
| Demographics | Rating | Rank | Unemployment Among Women with Children Ages 6 to 17 years |
| Immigrants | Mexico | 0.7 /100 | #258 | Tragic 9.5% |
| Immigrants | Central America | 0.6 /100 | #259 | Tragic 9.5% |
| Italians | 0.6 /100 | #260 | Tragic 9.5% |
| South Americans | 0.5 /100 | #261 | Tragic 9.5% |
| Senegalese | 0.5 /100 | #262 | Tragic 9.5% |
| Lebanese | 0.5 /100 | #263 | Tragic 9.5% |
| Immigrants | Ghana | 0.4 /100 | #264 | Tragic 9.5% |
| West Indians | 0.4 /100 | #265 | Tragic 9.5% |
| Immigrants | Jamaica | 0.3 /100 | #266 | Tragic 9.5% |
| Irish | 0.3 /100 | #267 | Tragic 9.5% |
| Ghanaians | 0.2 /100 | #268 | Tragic 9.6% |
| Blackfeet | 0.2 /100 | #269 | Tragic 9.6% |
| Immigrants | Nicaragua | 0.2 /100 | #270 | Tragic 9.6% |
| Immigrants | Latin America | 0.1 /100 | #271 | Tragic 9.6% |
| Kiowa | 0.1 /100 | #272 | Tragic 9.6% |