Immigrants from Spain vs Immigrants from Nepal Unemployment
COMPARE
Immigrants from Spain
Immigrants from Nepal
Unemployment
Unemployment Comparison
Immigrants from Spain
Immigrants from Nepal
5.1%
UNEMPLOYMENT
86.2/ 100
METRIC RATING
136th/ 347
METRIC RANK
4.8%
UNEMPLOYMENT
99.4/ 100
METRIC RATING
46th/ 347
METRIC RANK
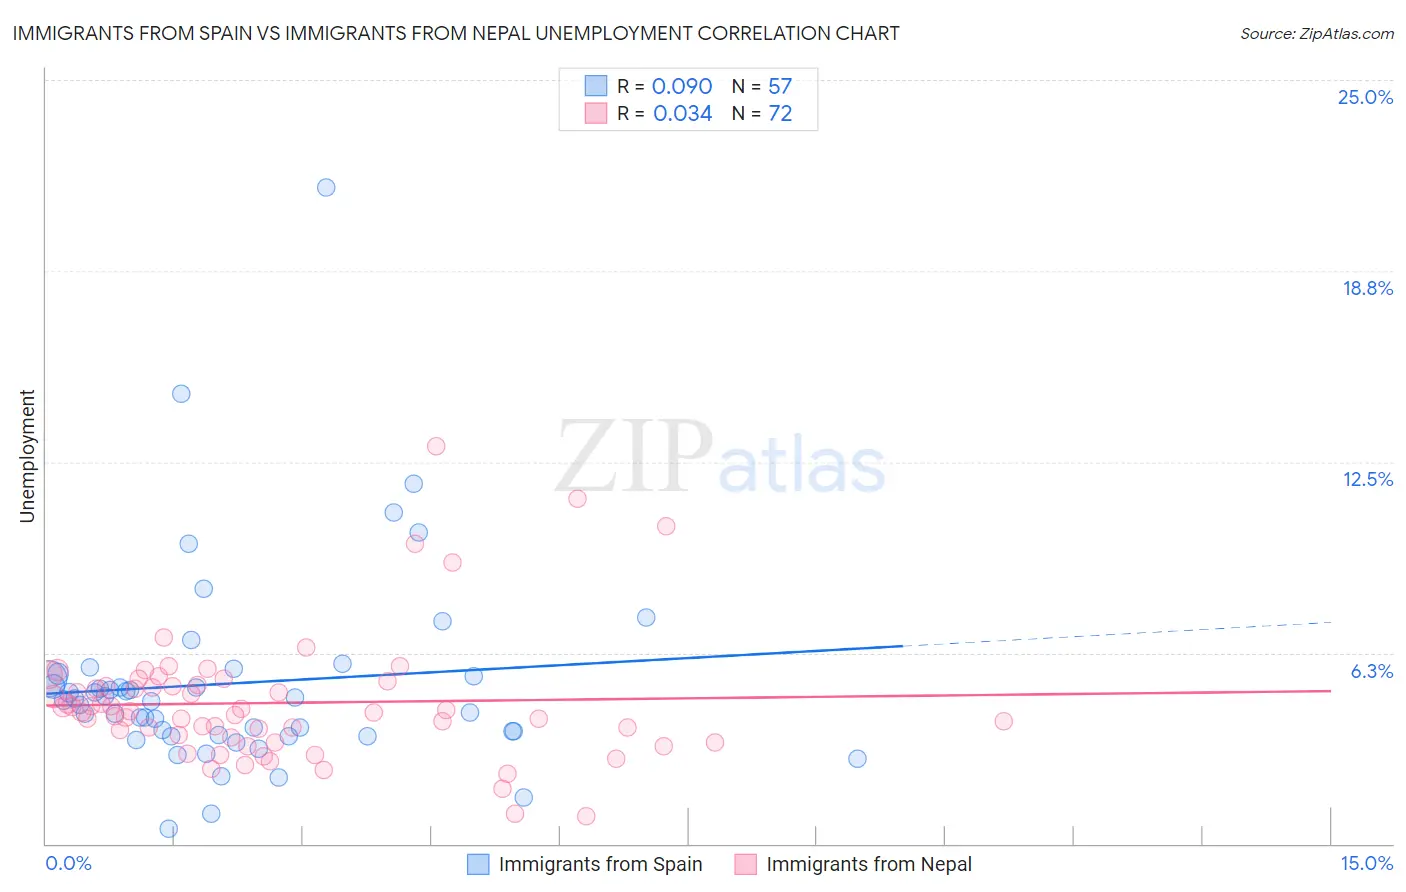
Immigrants from Spain vs Immigrants from Nepal Unemployment Correlation Chart
The statistical analysis conducted on geographies consisting of 239,621,444 people shows a slight positive correlation between the proportion of Immigrants from Spain and unemployment in the United States with a correlation coefficient (R) of 0.090 and weighted average of 5.1%. Similarly, the statistical analysis conducted on geographies consisting of 186,724,623 people shows no correlation between the proportion of Immigrants from Nepal and unemployment in the United States with a correlation coefficient (R) of 0.034 and weighted average of 4.8%, a difference of 5.5%.
Unemployment Correlation Summary
| Measurement | Immigrants from Spain | Immigrants from Nepal |
| Minimum | 0.50% | 0.90% |
| Maximum | 21.5% | 13.0% |
| Range | 21.0% | 12.1% |
| Mean | 5.3% | 4.6% |
| Median | 4.7% | 4.3% |
| Interquartile 25% (IQ1) | 3.5% | 3.5% |
| Interquartile 75% (IQ3) | 5.5% | 5.2% |
| Interquartile Range (IQR) | 2.0% | 1.6% |
| Standard Deviation (Sample) | 3.4% | 2.1% |
| Standard Deviation (Population) | 3.3% | 2.1% |
Similar Demographics by Unemployment
Demographics Similar to Immigrants from Spain by Unemployment
In terms of unemployment, the demographic groups most similar to Immigrants from Spain are Immigrants from Europe (5.1%, a difference of 0.010%), Immigrants from Burma/Myanmar (5.1%, a difference of 0.010%), Immigrants from Jordan (5.1%, a difference of 0.060%), Immigrants from Croatia (5.1%, a difference of 0.070%), and Immigrants from Ethiopia (5.1%, a difference of 0.070%).
| Demographics | Rating | Rank | Unemployment |
| Immigrants | Latvia | 88.0 /100 | #129 | Excellent 5.1% |
| Iranians | 86.9 /100 | #130 | Excellent 5.1% |
| Immigrants | Croatia | 86.8 /100 | #131 | Excellent 5.1% |
| Immigrants | Ethiopia | 86.7 /100 | #132 | Excellent 5.1% |
| Immigrants | Jordan | 86.6 /100 | #133 | Excellent 5.1% |
| Immigrants | Europe | 86.3 /100 | #134 | Excellent 5.1% |
| Immigrants | Burma/Myanmar | 86.2 /100 | #135 | Excellent 5.1% |
| Immigrants | Spain | 86.2 /100 | #136 | Excellent 5.1% |
| Immigrants | Saudi Arabia | 85.6 /100 | #137 | Excellent 5.1% |
| Immigrants | Hungary | 85.6 /100 | #138 | Excellent 5.1% |
| Pakistanis | 85.3 /100 | #139 | Excellent 5.1% |
| Immigrants | Denmark | 84.3 /100 | #140 | Excellent 5.1% |
| Palestinians | 83.4 /100 | #141 | Excellent 5.1% |
| Immigrants | Pakistan | 83.2 /100 | #142 | Excellent 5.1% |
| Immigrants | Chile | 82.8 /100 | #143 | Excellent 5.1% |
Demographics Similar to Immigrants from Nepal by Unemployment
In terms of unemployment, the demographic groups most similar to Immigrants from Nepal are Immigrants from Taiwan (4.8%, a difference of 0.020%), French (4.8%, a difference of 0.16%), Austrian (4.8%, a difference of 0.22%), Immigrants from Scotland (4.9%, a difference of 0.23%), and Immigrants from South Central Asia (4.9%, a difference of 0.24%).
| Demographics | Rating | Rank | Unemployment |
| Lithuanians | 99.7 /100 | #39 | Exceptional 4.8% |
| Northern Europeans | 99.7 /100 | #40 | Exceptional 4.8% |
| Immigrants | Bosnia and Herzegovina | 99.7 /100 | #41 | Exceptional 4.8% |
| Filipinos | 99.5 /100 | #42 | Exceptional 4.8% |
| Yugoslavians | 99.5 /100 | #43 | Exceptional 4.8% |
| Austrians | 99.5 /100 | #44 | Exceptional 4.8% |
| French | 99.5 /100 | #45 | Exceptional 4.8% |
| Immigrants | Nepal | 99.4 /100 | #46 | Exceptional 4.8% |
| Immigrants | Taiwan | 99.4 /100 | #47 | Exceptional 4.8% |
| Immigrants | Scotland | 99.3 /100 | #48 | Exceptional 4.9% |
| Immigrants | South Central Asia | 99.3 /100 | #49 | Exceptional 4.9% |
| French Canadians | 99.3 /100 | #50 | Exceptional 4.9% |
| Immigrants | Belgium | 99.2 /100 | #51 | Exceptional 4.9% |
| Whites/Caucasians | 99.2 /100 | #52 | Exceptional 4.9% |
| Immigrants | Zimbabwe | 99.2 /100 | #53 | Exceptional 4.9% |