Guatemalan vs Immigrants from Nepal Unemployment
COMPARE
Guatemalan
Immigrants from Nepal
Unemployment
Unemployment Comparison
Guatemalans
Immigrants from Nepal
5.8%
UNEMPLOYMENT
0.2/ 100
METRIC RATING
256th/ 347
METRIC RANK
4.8%
UNEMPLOYMENT
99.4/ 100
METRIC RATING
46th/ 347
METRIC RANK
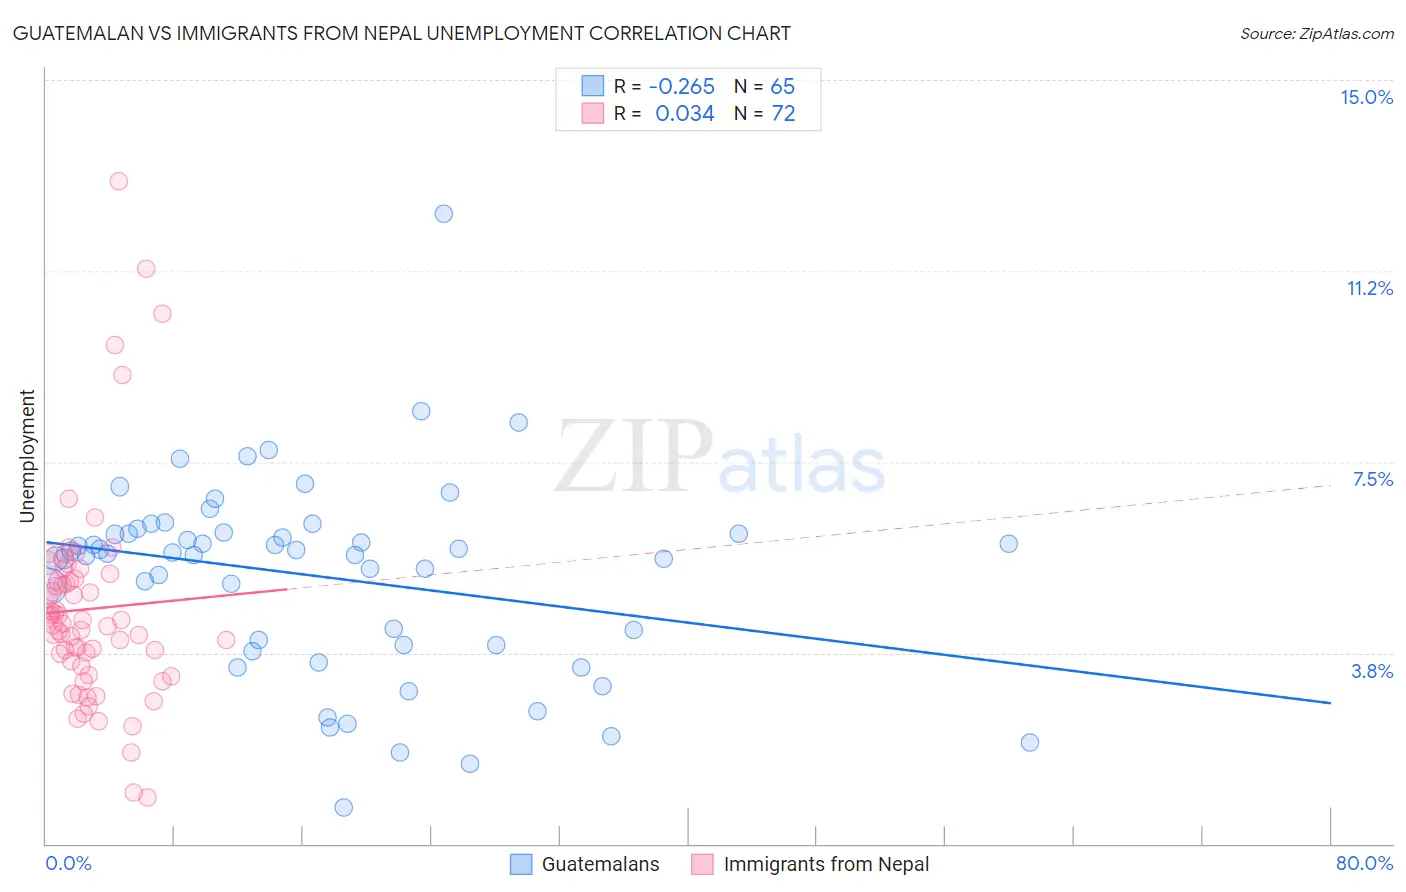
Guatemalan vs Immigrants from Nepal Unemployment Correlation Chart
The statistical analysis conducted on geographies consisting of 409,136,964 people shows a weak negative correlation between the proportion of Guatemalans and unemployment in the United States with a correlation coefficient (R) of -0.265 and weighted average of 5.8%. Similarly, the statistical analysis conducted on geographies consisting of 186,724,623 people shows no correlation between the proportion of Immigrants from Nepal and unemployment in the United States with a correlation coefficient (R) of 0.034 and weighted average of 4.8%, a difference of 18.9%.
Unemployment Correlation Summary
| Measurement | Guatemalan | Immigrants from Nepal |
| Minimum | 0.70% | 0.90% |
| Maximum | 12.4% | 13.0% |
| Range | 11.7% | 12.1% |
| Mean | 5.2% | 4.6% |
| Median | 5.7% | 4.3% |
| Interquartile 25% (IQ1) | 3.9% | 3.5% |
| Interquartile 75% (IQ3) | 6.1% | 5.2% |
| Interquartile Range (IQR) | 2.2% | 1.6% |
| Standard Deviation (Sample) | 1.9% | 2.1% |
| Standard Deviation (Population) | 1.9% | 2.1% |
Similar Demographics by Unemployment
Demographics Similar to Guatemalans by Unemployment
In terms of unemployment, the demographic groups most similar to Guatemalans are Immigrants from Portugal (5.7%, a difference of 0.21%), Yaqui (5.8%, a difference of 0.30%), Immigrants from Bahamas (5.8%, a difference of 0.44%), Subsaharan African (5.8%, a difference of 0.56%), and Immigrants from Uzbekistan (5.8%, a difference of 0.58%).
| Demographics | Rating | Rank | Unemployment |
| Cajuns | 0.8 /100 | #249 | Tragic 5.6% |
| Japanese | 0.8 /100 | #250 | Tragic 5.6% |
| Kiowa | 0.6 /100 | #251 | Tragic 5.7% |
| Hondurans | 0.3 /100 | #252 | Tragic 5.7% |
| Central Americans | 0.3 /100 | #253 | Tragic 5.7% |
| Immigrants | Honduras | 0.3 /100 | #254 | Tragic 5.7% |
| Immigrants | Portugal | 0.2 /100 | #255 | Tragic 5.7% |
| Guatemalans | 0.2 /100 | #256 | Tragic 5.8% |
| Yaqui | 0.2 /100 | #257 | Tragic 5.8% |
| Immigrants | Bahamas | 0.1 /100 | #258 | Tragic 5.8% |
| Sub-Saharan Africans | 0.1 /100 | #259 | Tragic 5.8% |
| Immigrants | Uzbekistan | 0.1 /100 | #260 | Tragic 5.8% |
| Immigrants | Guatemala | 0.1 /100 | #261 | Tragic 5.8% |
| Sierra Leoneans | 0.1 /100 | #262 | Tragic 5.8% |
| Salvadorans | 0.1 /100 | #263 | Tragic 5.8% |
Demographics Similar to Immigrants from Nepal by Unemployment
In terms of unemployment, the demographic groups most similar to Immigrants from Nepal are Immigrants from Taiwan (4.8%, a difference of 0.020%), French (4.8%, a difference of 0.16%), Austrian (4.8%, a difference of 0.22%), Immigrants from Scotland (4.9%, a difference of 0.23%), and Immigrants from South Central Asia (4.9%, a difference of 0.24%).
| Demographics | Rating | Rank | Unemployment |
| Lithuanians | 99.7 /100 | #39 | Exceptional 4.8% |
| Northern Europeans | 99.7 /100 | #40 | Exceptional 4.8% |
| Immigrants | Bosnia and Herzegovina | 99.7 /100 | #41 | Exceptional 4.8% |
| Filipinos | 99.5 /100 | #42 | Exceptional 4.8% |
| Yugoslavians | 99.5 /100 | #43 | Exceptional 4.8% |
| Austrians | 99.5 /100 | #44 | Exceptional 4.8% |
| French | 99.5 /100 | #45 | Exceptional 4.8% |
| Immigrants | Nepal | 99.4 /100 | #46 | Exceptional 4.8% |
| Immigrants | Taiwan | 99.4 /100 | #47 | Exceptional 4.8% |
| Immigrants | Scotland | 99.3 /100 | #48 | Exceptional 4.9% |
| Immigrants | South Central Asia | 99.3 /100 | #49 | Exceptional 4.9% |
| French Canadians | 99.3 /100 | #50 | Exceptional 4.9% |
| Immigrants | Belgium | 99.2 /100 | #51 | Exceptional 4.9% |
| Whites/Caucasians | 99.2 /100 | #52 | Exceptional 4.9% |
| Immigrants | Zimbabwe | 99.2 /100 | #53 | Exceptional 4.9% |