Zimbabwean vs Immigrants from Ecuador Unemployment Among Women with Children Ages 6 to 17 years
COMPARE
Zimbabwean
Immigrants from Ecuador
Unemployment Among Women with Children Ages 6 to 17 years
Unemployment Among Women with Children Ages 6 to 17 years Comparison
Zimbabweans
Immigrants from Ecuador
8.6%
UNEMPLOYMENT AMONG WOMEN WITH CHILDREN AGES 6 TO 17 YEARS
96.3/ 100
METRIC RATING
116th/ 347
METRIC RANK
10.2%
UNEMPLOYMENT AMONG WOMEN WITH CHILDREN AGES 6 TO 17 YEARS
0.0/ 100
METRIC RATING
303rd/ 347
METRIC RANK
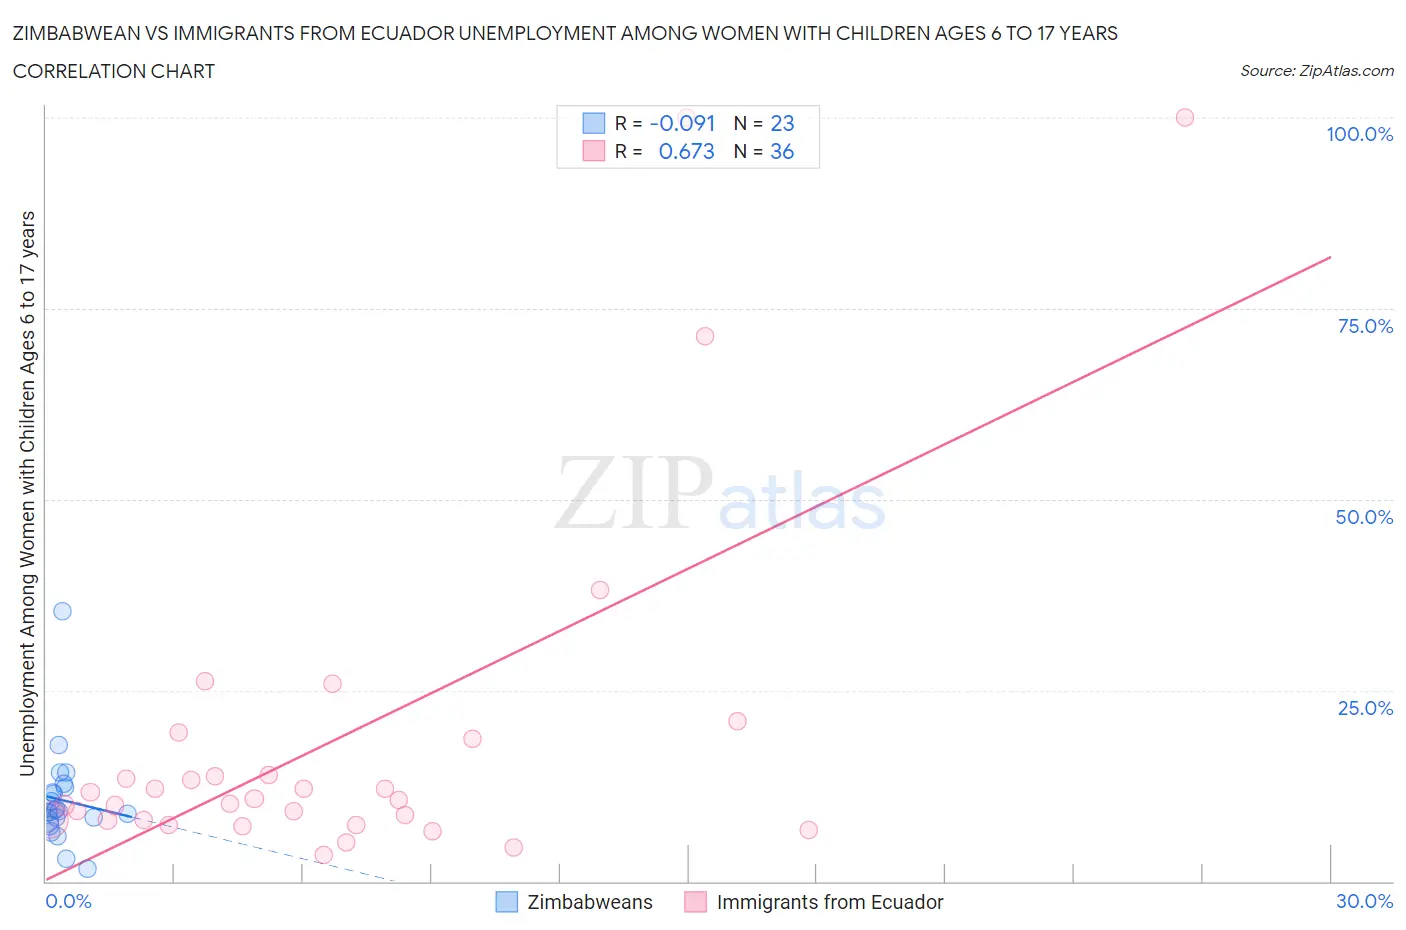
Zimbabwean vs Immigrants from Ecuador Unemployment Among Women with Children Ages 6 to 17 years Correlation Chart
The statistical analysis conducted on geographies consisting of 62,721,931 people shows a slight negative correlation between the proportion of Zimbabweans and unemployment rate among women with children between the ages 6 and 17 in the United States with a correlation coefficient (R) of -0.091 and weighted average of 8.6%. Similarly, the statistical analysis conducted on geographies consisting of 212,439,622 people shows a significant positive correlation between the proportion of Immigrants from Ecuador and unemployment rate among women with children between the ages 6 and 17 in the United States with a correlation coefficient (R) of 0.673 and weighted average of 10.2%, a difference of 17.8%.
Unemployment Among Women with Children Ages 6 to 17 years Correlation Summary
| Measurement | Zimbabwean | Immigrants from Ecuador |
| Minimum | 1.7% | 3.5% |
| Maximum | 35.3% | 100.0% |
| Range | 33.6% | 96.5% |
| Mean | 10.6% | 18.7% |
| Median | 9.2% | 10.7% |
| Interquartile 25% (IQ1) | 7.9% | 8.0% |
| Interquartile 75% (IQ3) | 12.3% | 16.3% |
| Interquartile Range (IQR) | 4.4% | 8.3% |
| Standard Deviation (Sample) | 6.5% | 23.3% |
| Standard Deviation (Population) | 6.3% | 23.0% |
Similar Demographics by Unemployment Among Women with Children Ages 6 to 17 years
Demographics Similar to Zimbabweans by Unemployment Among Women with Children Ages 6 to 17 years
In terms of unemployment among women with children ages 6 to 17 years, the demographic groups most similar to Zimbabweans are Albanian (8.6%, a difference of 0.010%), Pueblo (8.6%, a difference of 0.040%), Immigrants from Grenada (8.6%, a difference of 0.050%), Argentinean (8.6%, a difference of 0.070%), and Israeli (8.7%, a difference of 0.13%).
| Demographics | Rating | Rank | Unemployment Among Women with Children Ages 6 to 17 years |
| Immigrants | Romania | 97.5 /100 | #109 | Exceptional 8.6% |
| Latvians | 97.4 /100 | #110 | Exceptional 8.6% |
| Immigrants | Ukraine | 97.4 /100 | #111 | Exceptional 8.6% |
| Romanians | 97.1 /100 | #112 | Exceptional 8.6% |
| Eastern Europeans | 96.8 /100 | #113 | Exceptional 8.6% |
| Immigrants | Russia | 96.7 /100 | #114 | Exceptional 8.6% |
| Argentineans | 96.5 /100 | #115 | Exceptional 8.6% |
| Zimbabweans | 96.3 /100 | #116 | Exceptional 8.6% |
| Albanians | 96.3 /100 | #117 | Exceptional 8.6% |
| Pueblo | 96.2 /100 | #118 | Exceptional 8.6% |
| Immigrants | Grenada | 96.2 /100 | #119 | Exceptional 8.6% |
| Israelis | 95.9 /100 | #120 | Exceptional 8.7% |
| Immigrants | Denmark | 95.5 /100 | #121 | Exceptional 8.7% |
| Immigrants | Egypt | 95.0 /100 | #122 | Exceptional 8.7% |
| Immigrants | Morocco | 94.9 /100 | #123 | Exceptional 8.7% |
Demographics Similar to Immigrants from Ecuador by Unemployment Among Women with Children Ages 6 to 17 years
In terms of unemployment among women with children ages 6 to 17 years, the demographic groups most similar to Immigrants from Ecuador are Immigrants from Venezuela (10.2%, a difference of 0.090%), Immigrants from Nigeria (10.2%, a difference of 0.15%), Venezuelan (10.2%, a difference of 0.17%), Paraguayan (10.2%, a difference of 0.44%), and Immigrants from Bahamas (10.1%, a difference of 0.62%).
| Demographics | Rating | Rank | Unemployment Among Women with Children Ages 6 to 17 years |
| Immigrants | Western Africa | 0.0 /100 | #296 | Tragic 10.1% |
| Immigrants | Caribbean | 0.0 /100 | #297 | Tragic 10.1% |
| Immigrants | Haiti | 0.0 /100 | #298 | Tragic 10.1% |
| Immigrants | Honduras | 0.0 /100 | #299 | Tragic 10.1% |
| Nigerians | 0.0 /100 | #300 | Tragic 10.1% |
| Immigrants | Bahamas | 0.0 /100 | #301 | Tragic 10.1% |
| Venezuelans | 0.0 /100 | #302 | Tragic 10.2% |
| Immigrants | Ecuador | 0.0 /100 | #303 | Tragic 10.2% |
| Immigrants | Venezuela | 0.0 /100 | #304 | Tragic 10.2% |
| Immigrants | Nigeria | 0.0 /100 | #305 | Tragic 10.2% |
| Paraguayans | 0.0 /100 | #306 | Tragic 10.2% |
| Immigrants | Senegal | 0.0 /100 | #307 | Tragic 10.2% |
| Dutch West Indians | 0.0 /100 | #308 | Tragic 10.2% |
| French Canadians | 0.0 /100 | #309 | Tragic 10.3% |
| Alaska Natives | 0.0 /100 | #310 | Tragic 10.3% |