Immigrants from Zimbabwe vs Immigrants from Ecuador Unemployment Among Women with Children Ages 6 to 17 years
COMPARE
Immigrants from Zimbabwe
Immigrants from Ecuador
Unemployment Among Women with Children Ages 6 to 17 years
Unemployment Among Women with Children Ages 6 to 17 years Comparison
Immigrants from Zimbabwe
Immigrants from Ecuador
8.0%
UNEMPLOYMENT AMONG WOMEN WITH CHILDREN AGES 6 TO 17 YEARS
100.0/ 100
METRIC RATING
40th/ 347
METRIC RANK
10.2%
UNEMPLOYMENT AMONG WOMEN WITH CHILDREN AGES 6 TO 17 YEARS
0.0/ 100
METRIC RATING
303rd/ 347
METRIC RANK
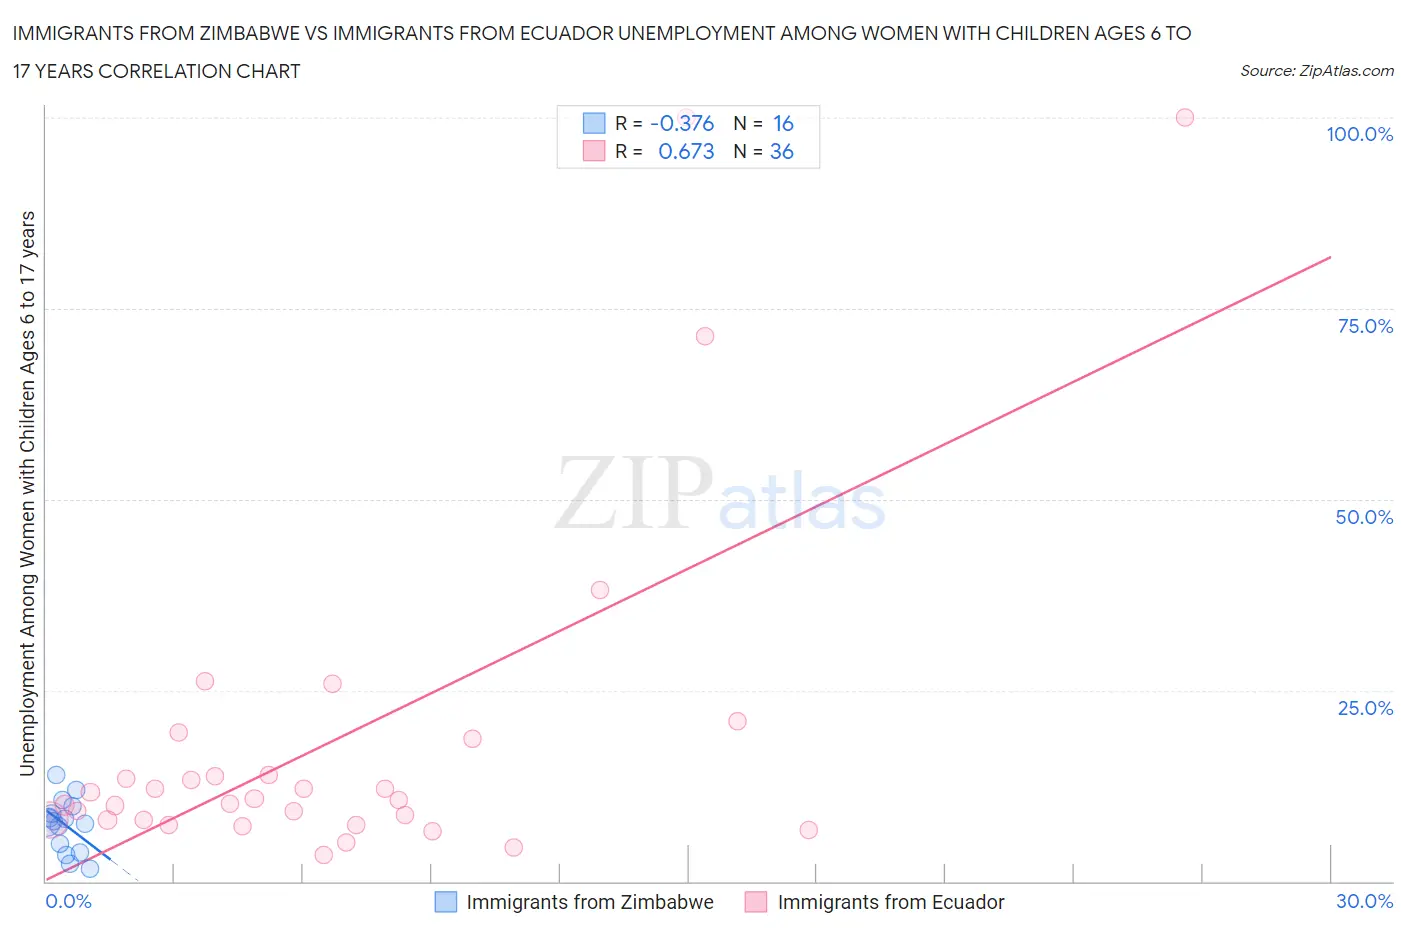
Immigrants from Zimbabwe vs Immigrants from Ecuador Unemployment Among Women with Children Ages 6 to 17 years Correlation Chart
The statistical analysis conducted on geographies consisting of 102,903,868 people shows a mild negative correlation between the proportion of Immigrants from Zimbabwe and unemployment rate among women with children between the ages 6 and 17 in the United States with a correlation coefficient (R) of -0.376 and weighted average of 8.0%. Similarly, the statistical analysis conducted on geographies consisting of 212,439,622 people shows a significant positive correlation between the proportion of Immigrants from Ecuador and unemployment rate among women with children between the ages 6 and 17 in the United States with a correlation coefficient (R) of 0.673 and weighted average of 10.2%, a difference of 26.9%.
Unemployment Among Women with Children Ages 6 to 17 years Correlation Summary
| Measurement | Immigrants from Zimbabwe | Immigrants from Ecuador |
| Minimum | 1.7% | 3.5% |
| Maximum | 13.8% | 100.0% |
| Range | 12.1% | 96.5% |
| Mean | 7.4% | 18.7% |
| Median | 7.7% | 10.7% |
| Interquartile 25% (IQ1) | 4.3% | 8.0% |
| Interquartile 75% (IQ3) | 9.3% | 16.3% |
| Interquartile Range (IQR) | 5.0% | 8.3% |
| Standard Deviation (Sample) | 3.4% | 23.3% |
| Standard Deviation (Population) | 3.3% | 23.0% |
Similar Demographics by Unemployment Among Women with Children Ages 6 to 17 years
Demographics Similar to Immigrants from Zimbabwe by Unemployment Among Women with Children Ages 6 to 17 years
In terms of unemployment among women with children ages 6 to 17 years, the demographic groups most similar to Immigrants from Zimbabwe are Iranian (8.0%, a difference of 0.070%), Somali (8.0%, a difference of 0.29%), Immigrants from Somalia (8.0%, a difference of 0.34%), Alsatian (8.0%, a difference of 0.43%), and Bhutanese (8.1%, a difference of 0.48%).
| Demographics | Rating | Rank | Unemployment Among Women with Children Ages 6 to 17 years |
| Immigrants | Korea | 100.0 /100 | #33 | Exceptional 7.9% |
| Native Hawaiians | 100.0 /100 | #34 | Exceptional 7.9% |
| Immigrants | South Central Asia | 100.0 /100 | #35 | Exceptional 7.9% |
| Burmese | 100.0 /100 | #36 | Exceptional 8.0% |
| Asians | 100.0 /100 | #37 | Exceptional 8.0% |
| Alsatians | 100.0 /100 | #38 | Exceptional 8.0% |
| Somalis | 100.0 /100 | #39 | Exceptional 8.0% |
| Immigrants | Zimbabwe | 100.0 /100 | #40 | Exceptional 8.0% |
| Iranians | 100.0 /100 | #41 | Exceptional 8.0% |
| Immigrants | Somalia | 100.0 /100 | #42 | Exceptional 8.0% |
| Bhutanese | 100.0 /100 | #43 | Exceptional 8.1% |
| Immigrants | Sweden | 100.0 /100 | #44 | Exceptional 8.1% |
| Immigrants | Bulgaria | 100.0 /100 | #45 | Exceptional 8.1% |
| Icelanders | 100.0 /100 | #46 | Exceptional 8.1% |
| Immigrants | Switzerland | 100.0 /100 | #47 | Exceptional 8.1% |
Demographics Similar to Immigrants from Ecuador by Unemployment Among Women with Children Ages 6 to 17 years
In terms of unemployment among women with children ages 6 to 17 years, the demographic groups most similar to Immigrants from Ecuador are Immigrants from Venezuela (10.2%, a difference of 0.090%), Immigrants from Nigeria (10.2%, a difference of 0.15%), Venezuelan (10.2%, a difference of 0.17%), Paraguayan (10.2%, a difference of 0.44%), and Immigrants from Bahamas (10.1%, a difference of 0.62%).
| Demographics | Rating | Rank | Unemployment Among Women with Children Ages 6 to 17 years |
| Immigrants | Western Africa | 0.0 /100 | #296 | Tragic 10.1% |
| Immigrants | Caribbean | 0.0 /100 | #297 | Tragic 10.1% |
| Immigrants | Haiti | 0.0 /100 | #298 | Tragic 10.1% |
| Immigrants | Honduras | 0.0 /100 | #299 | Tragic 10.1% |
| Nigerians | 0.0 /100 | #300 | Tragic 10.1% |
| Immigrants | Bahamas | 0.0 /100 | #301 | Tragic 10.1% |
| Venezuelans | 0.0 /100 | #302 | Tragic 10.2% |
| Immigrants | Ecuador | 0.0 /100 | #303 | Tragic 10.2% |
| Immigrants | Venezuela | 0.0 /100 | #304 | Tragic 10.2% |
| Immigrants | Nigeria | 0.0 /100 | #305 | Tragic 10.2% |
| Paraguayans | 0.0 /100 | #306 | Tragic 10.2% |
| Immigrants | Senegal | 0.0 /100 | #307 | Tragic 10.2% |
| Dutch West Indians | 0.0 /100 | #308 | Tragic 10.2% |
| French Canadians | 0.0 /100 | #309 | Tragic 10.3% |
| Alaska Natives | 0.0 /100 | #310 | Tragic 10.3% |