Immigrants from Brazil vs Immigrants from Ecuador Unemployment Among Women with Children Ages 6 to 17 years
COMPARE
Immigrants from Brazil
Immigrants from Ecuador
Unemployment Among Women with Children Ages 6 to 17 years
Unemployment Among Women with Children Ages 6 to 17 years Comparison
Immigrants from Brazil
Immigrants from Ecuador
9.0%
UNEMPLOYMENT AMONG WOMEN WITH CHILDREN AGES 6 TO 17 YEARS
51.0/ 100
METRIC RATING
173rd/ 347
METRIC RANK
10.2%
UNEMPLOYMENT AMONG WOMEN WITH CHILDREN AGES 6 TO 17 YEARS
0.0/ 100
METRIC RATING
303rd/ 347
METRIC RANK
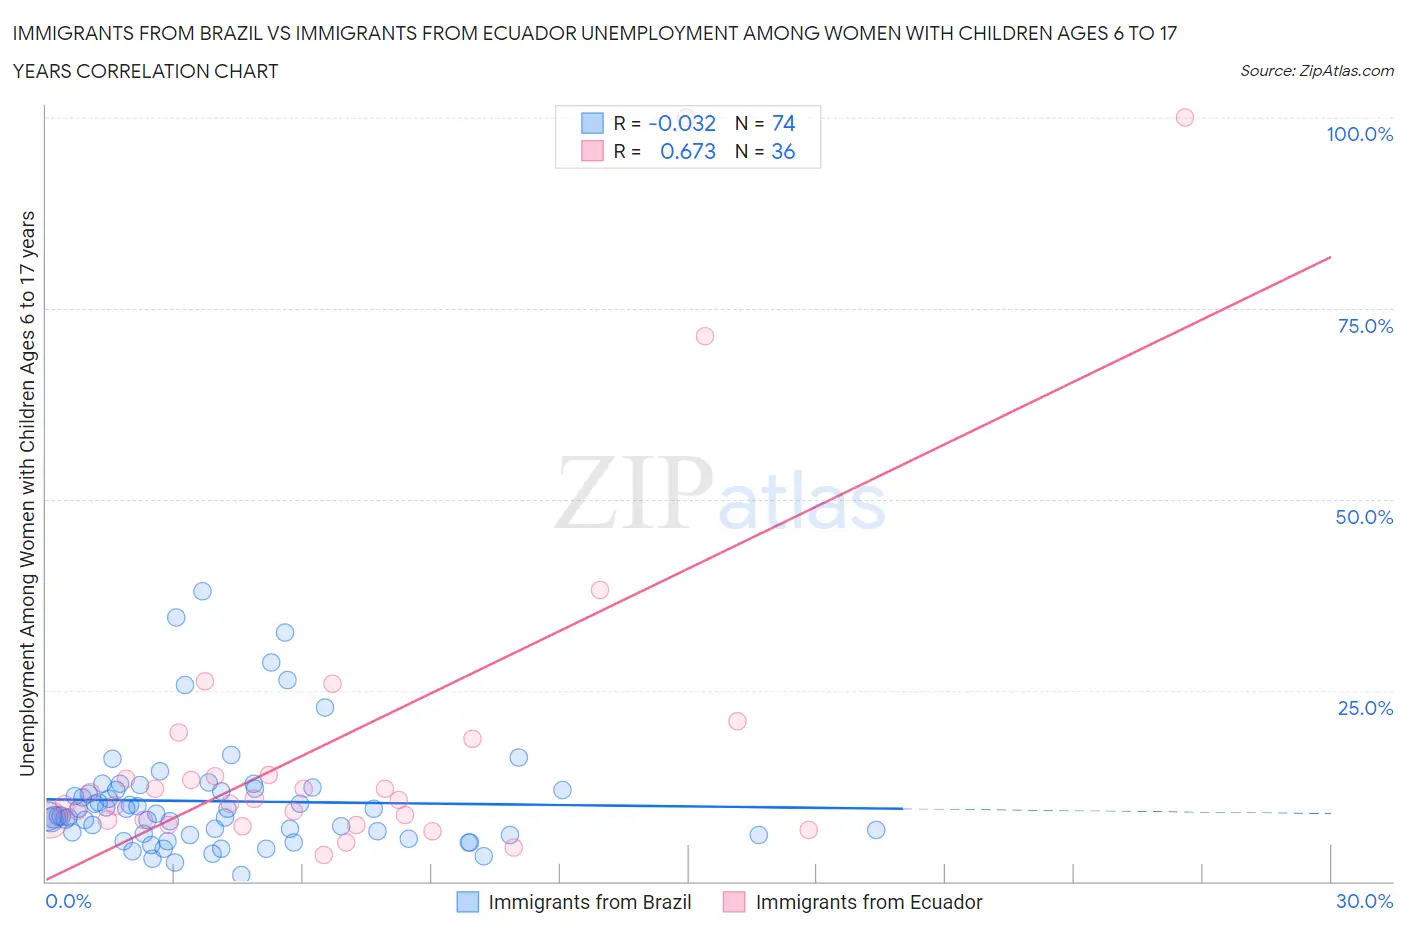
Immigrants from Brazil vs Immigrants from Ecuador Unemployment Among Women with Children Ages 6 to 17 years Correlation Chart
The statistical analysis conducted on geographies consisting of 251,390,083 people shows no correlation between the proportion of Immigrants from Brazil and unemployment rate among women with children between the ages 6 and 17 in the United States with a correlation coefficient (R) of -0.032 and weighted average of 9.0%. Similarly, the statistical analysis conducted on geographies consisting of 212,439,622 people shows a significant positive correlation between the proportion of Immigrants from Ecuador and unemployment rate among women with children between the ages 6 and 17 in the United States with a correlation coefficient (R) of 0.673 and weighted average of 10.2%, a difference of 13.6%.
Unemployment Among Women with Children Ages 6 to 17 years Correlation Summary
| Measurement | Immigrants from Brazil | Immigrants from Ecuador |
| Minimum | 0.90% | 3.5% |
| Maximum | 37.9% | 100.0% |
| Range | 37.0% | 96.5% |
| Mean | 10.5% | 18.7% |
| Median | 8.5% | 10.7% |
| Interquartile 25% (IQ1) | 6.1% | 8.0% |
| Interquartile 75% (IQ3) | 12.0% | 16.3% |
| Interquartile Range (IQR) | 5.9% | 8.3% |
| Standard Deviation (Sample) | 7.2% | 23.3% |
| Standard Deviation (Population) | 7.2% | 23.0% |
Similar Demographics by Unemployment Among Women with Children Ages 6 to 17 years
Demographics Similar to Immigrants from Brazil by Unemployment Among Women with Children Ages 6 to 17 years
In terms of unemployment among women with children ages 6 to 17 years, the demographic groups most similar to Immigrants from Brazil are Jordanian (9.0%, a difference of 0.050%), Immigrants from West Indies (9.0%, a difference of 0.050%), Immigrants from Costa Rica (9.0%, a difference of 0.050%), Turkish (8.9%, a difference of 0.14%), and British (8.9%, a difference of 0.19%).
| Demographics | Rating | Rank | Unemployment Among Women with Children Ages 6 to 17 years |
| Moroccans | 58.3 /100 | #166 | Average 8.9% |
| Immigrants | England | 57.7 /100 | #167 | Average 8.9% |
| Immigrants | Croatia | 57.1 /100 | #168 | Average 8.9% |
| British | 55.2 /100 | #169 | Average 8.9% |
| Turks | 54.1 /100 | #170 | Average 8.9% |
| Jordanians | 52.2 /100 | #171 | Average 9.0% |
| Immigrants | West Indies | 52.2 /100 | #172 | Average 9.0% |
| Immigrants | Brazil | 51.0 /100 | #173 | Average 9.0% |
| Immigrants | Costa Rica | 50.0 /100 | #174 | Average 9.0% |
| Immigrants | Sierra Leone | 45.9 /100 | #175 | Average 9.0% |
| Immigrants | Italy | 43.7 /100 | #176 | Average 9.0% |
| Immigrants | Jordan | 41.6 /100 | #177 | Average 9.0% |
| Menominee | 39.3 /100 | #178 | Fair 9.0% |
| Immigrants | Zaire | 38.3 /100 | #179 | Fair 9.0% |
| Ethiopians | 37.6 /100 | #180 | Fair 9.0% |
Demographics Similar to Immigrants from Ecuador by Unemployment Among Women with Children Ages 6 to 17 years
In terms of unemployment among women with children ages 6 to 17 years, the demographic groups most similar to Immigrants from Ecuador are Immigrants from Venezuela (10.2%, a difference of 0.090%), Immigrants from Nigeria (10.2%, a difference of 0.15%), Venezuelan (10.2%, a difference of 0.17%), Paraguayan (10.2%, a difference of 0.44%), and Immigrants from Bahamas (10.1%, a difference of 0.62%).
| Demographics | Rating | Rank | Unemployment Among Women with Children Ages 6 to 17 years |
| Immigrants | Western Africa | 0.0 /100 | #296 | Tragic 10.1% |
| Immigrants | Caribbean | 0.0 /100 | #297 | Tragic 10.1% |
| Immigrants | Haiti | 0.0 /100 | #298 | Tragic 10.1% |
| Immigrants | Honduras | 0.0 /100 | #299 | Tragic 10.1% |
| Nigerians | 0.0 /100 | #300 | Tragic 10.1% |
| Immigrants | Bahamas | 0.0 /100 | #301 | Tragic 10.1% |
| Venezuelans | 0.0 /100 | #302 | Tragic 10.2% |
| Immigrants | Ecuador | 0.0 /100 | #303 | Tragic 10.2% |
| Immigrants | Venezuela | 0.0 /100 | #304 | Tragic 10.2% |
| Immigrants | Nigeria | 0.0 /100 | #305 | Tragic 10.2% |
| Paraguayans | 0.0 /100 | #306 | Tragic 10.2% |
| Immigrants | Senegal | 0.0 /100 | #307 | Tragic 10.2% |
| Dutch West Indians | 0.0 /100 | #308 | Tragic 10.2% |
| French Canadians | 0.0 /100 | #309 | Tragic 10.3% |
| Alaska Natives | 0.0 /100 | #310 | Tragic 10.3% |