Native Hawaiian vs British Unemployment
COMPARE
Native Hawaiian
British
Unemployment
Unemployment Comparison
Native Hawaiians
British
5.3%
UNEMPLOYMENT
24.1/ 100
METRIC RATING
205th/ 347
METRIC RANK
4.7%
UNEMPLOYMENT
99.9/ 100
METRIC RATING
23rd/ 347
METRIC RANK
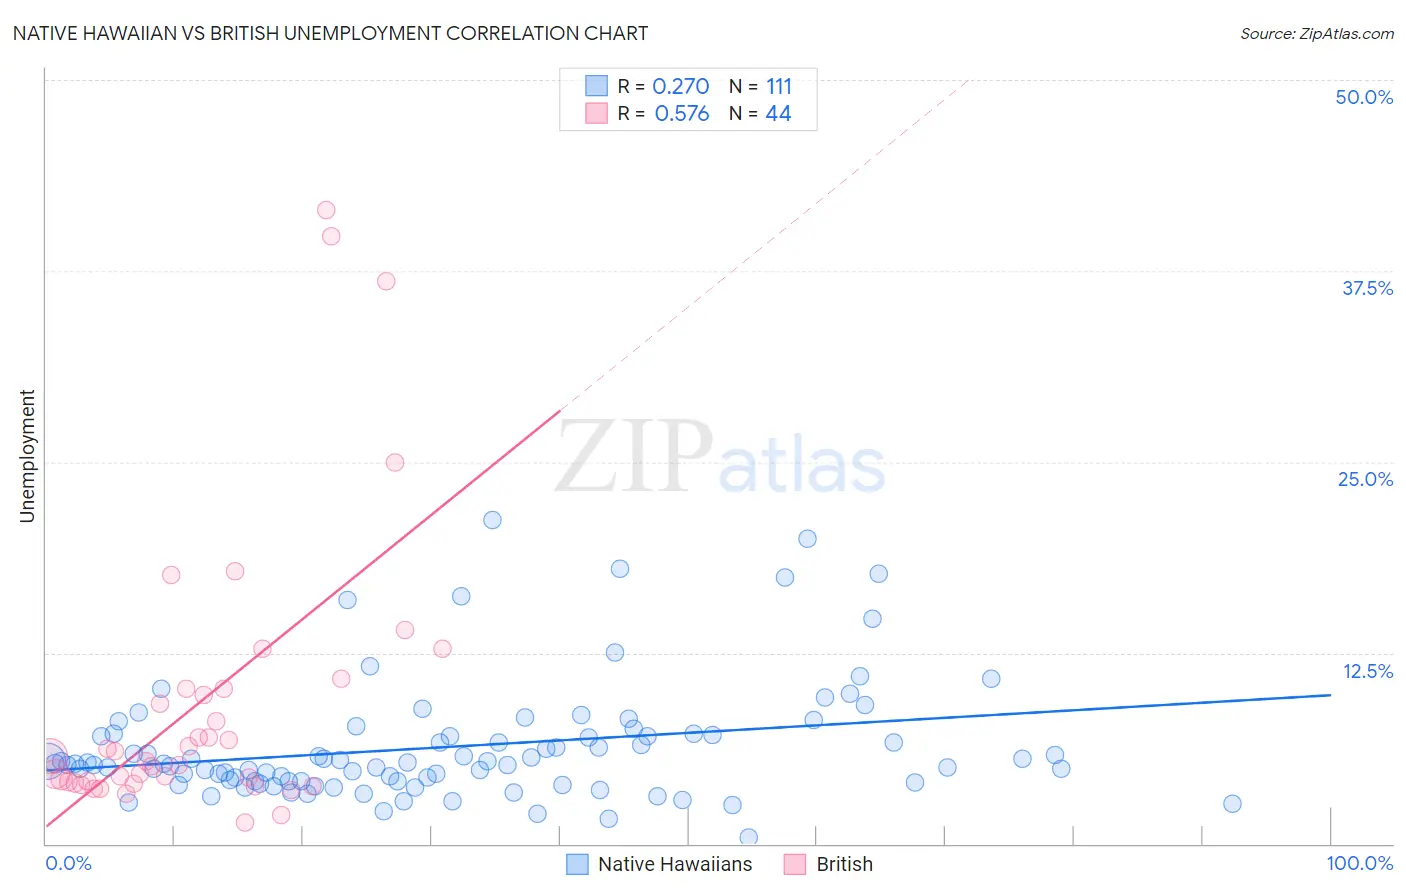
Native Hawaiian vs British Unemployment Correlation Chart
The statistical analysis conducted on geographies consisting of 331,714,087 people shows a weak positive correlation between the proportion of Native Hawaiians and unemployment in the United States with a correlation coefficient (R) of 0.270 and weighted average of 5.3%. Similarly, the statistical analysis conducted on geographies consisting of 529,433,741 people shows a substantial positive correlation between the proportion of British and unemployment in the United States with a correlation coefficient (R) of 0.576 and weighted average of 4.7%, a difference of 13.7%.
Unemployment Correlation Summary
| Measurement | Native Hawaiian | British |
| Minimum | 0.40% | 1.4% |
| Maximum | 21.2% | 41.5% |
| Range | 20.8% | 40.1% |
| Mean | 6.3% | 9.3% |
| Median | 5.3% | 5.6% |
| Interquartile 25% (IQ1) | 4.1% | 4.0% |
| Interquartile 75% (IQ3) | 7.1% | 10.1% |
| Interquartile Range (IQR) | 3.0% | 6.1% |
| Standard Deviation (Sample) | 3.9% | 9.5% |
| Standard Deviation (Population) | 3.8% | 9.4% |
Similar Demographics by Unemployment
Demographics Similar to Native Hawaiians by Unemployment
In terms of unemployment, the demographic groups most similar to Native Hawaiians are Immigrants from Ukraine (5.3%, a difference of 0.060%), Immigrants from Micronesia (5.3%, a difference of 0.080%), Cherokee (5.3%, a difference of 0.11%), Immigrants from Peru (5.4%, a difference of 0.13%), and Immigrants from South Eastern Asia (5.3%, a difference of 0.23%).
| Demographics | Rating | Rank | Unemployment |
| Immigrants | Israel | 28.6 /100 | #198 | Fair 5.3% |
| Immigrants | Afghanistan | 28.6 /100 | #199 | Fair 5.3% |
| Koreans | 27.4 /100 | #200 | Fair 5.3% |
| Immigrants | South Eastern Asia | 27.0 /100 | #201 | Fair 5.3% |
| Cherokee | 25.5 /100 | #202 | Fair 5.3% |
| Immigrants | Micronesia | 25.2 /100 | #203 | Fair 5.3% |
| Immigrants | Ukraine | 24.9 /100 | #204 | Fair 5.3% |
| Native Hawaiians | 24.1 /100 | #205 | Fair 5.3% |
| Immigrants | Peru | 22.7 /100 | #206 | Fair 5.4% |
| Creek | 19.4 /100 | #207 | Poor 5.4% |
| Portuguese | 19.0 /100 | #208 | Poor 5.4% |
| Immigrants | Iran | 18.8 /100 | #209 | Poor 5.4% |
| Immigrants | Iraq | 18.6 /100 | #210 | Poor 5.4% |
| Iraqis | 18.1 /100 | #211 | Poor 5.4% |
| Ugandans | 18.0 /100 | #212 | Poor 5.4% |
Demographics Similar to British by Unemployment
In terms of unemployment, the demographic groups most similar to British are Venezuelan (4.7%, a difference of 0.080%), Latvian (4.7%, a difference of 0.15%), Bulgarian (4.7%, a difference of 0.19%), Welsh (4.7%, a difference of 0.30%), and Thai (4.7%, a difference of 0.30%).
| Demographics | Rating | Rank | Unemployment |
| Chinese | 99.9 /100 | #16 | Exceptional 4.7% |
| Slovenes | 99.9 /100 | #17 | Exceptional 4.7% |
| Immigrants | Venezuela | 99.9 /100 | #18 | Exceptional 4.7% |
| Scottish | 99.9 /100 | #19 | Exceptional 4.7% |
| Carpatho Rusyns | 99.9 /100 | #20 | Exceptional 4.7% |
| Welsh | 99.9 /100 | #21 | Exceptional 4.7% |
| Thais | 99.9 /100 | #22 | Exceptional 4.7% |
| British | 99.9 /100 | #23 | Exceptional 4.7% |
| Venezuelans | 99.9 /100 | #24 | Exceptional 4.7% |
| Latvians | 99.9 /100 | #25 | Exceptional 4.7% |
| Bulgarians | 99.9 /100 | #26 | Exceptional 4.7% |
| Finns | 99.9 /100 | #27 | Exceptional 4.7% |
| Cubans | 99.8 /100 | #28 | Exceptional 4.7% |
| Poles | 99.8 /100 | #29 | Exceptional 4.7% |
| Irish | 99.8 /100 | #30 | Exceptional 4.8% |