Native Hawaiian vs Menominee Professional Degree
COMPARE
Native Hawaiian
Menominee
Professional Degree
Professional Degree Comparison
Native Hawaiians
Menominee
3.8%
PROFESSIONAL DEGREE
2.3/ 100
METRIC RATING
242nd/ 347
METRIC RANK
3.1%
PROFESSIONAL DEGREE
0.0/ 100
METRIC RATING
326th/ 347
METRIC RANK
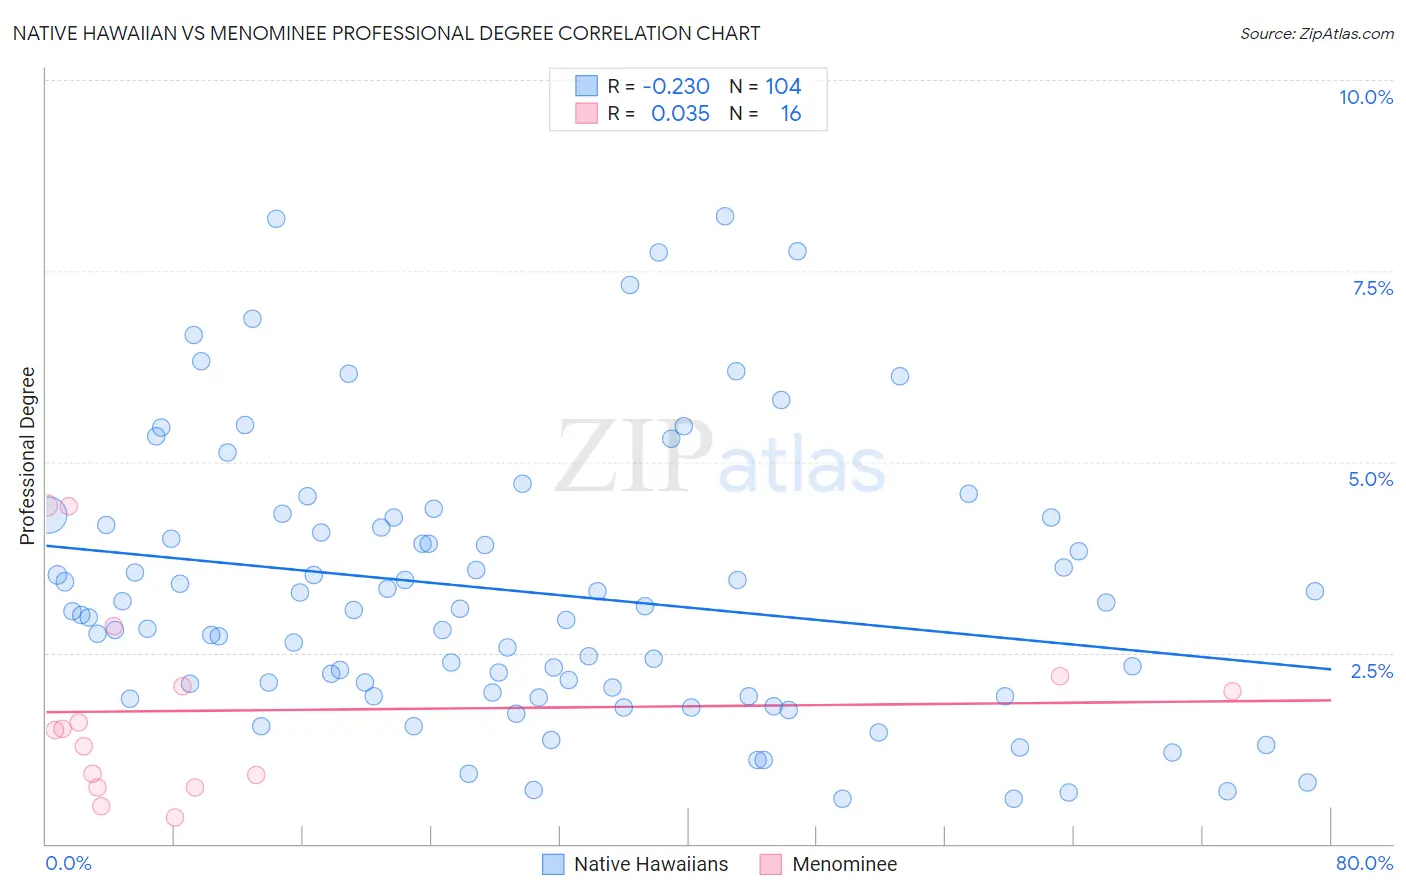
Native Hawaiian vs Menominee Professional Degree Correlation Chart
The statistical analysis conducted on geographies consisting of 331,121,710 people shows a weak negative correlation between the proportion of Native Hawaiians and percentage of population with at least professional degree education in the United States with a correlation coefficient (R) of -0.230 and weighted average of 3.8%. Similarly, the statistical analysis conducted on geographies consisting of 45,721,349 people shows no correlation between the proportion of Menominee and percentage of population with at least professional degree education in the United States with a correlation coefficient (R) of 0.035 and weighted average of 3.1%, a difference of 22.7%.
Professional Degree Correlation Summary
| Measurement | Native Hawaiian | Menominee |
| Minimum | 0.59% | 0.35% |
| Maximum | 8.2% | 4.4% |
| Range | 7.6% | 4.1% |
| Mean | 3.3% | 1.7% |
| Median | 3.0% | 1.5% |
| Interquartile 25% (IQ1) | 2.0% | 0.82% |
| Interquartile 75% (IQ3) | 4.2% | 2.1% |
| Interquartile Range (IQR) | 2.3% | 1.3% |
| Standard Deviation (Sample) | 1.8% | 1.2% |
| Standard Deviation (Population) | 1.8% | 1.2% |
Similar Demographics by Professional Degree
Demographics Similar to Native Hawaiians by Professional Degree
In terms of professional degree, the demographic groups most similar to Native Hawaiians are Alaskan Athabascan (3.8%, a difference of 0.0%), Immigrants from Ecuador (3.8%, a difference of 0.020%), Guamanian/Chamorro (3.8%, a difference of 0.080%), British West Indian (3.8%, a difference of 0.25%), and Immigrants from Bahamas (3.8%, a difference of 0.51%).
| Demographics | Rating | Rank | Professional Degree |
| Immigrants | Barbados | 4.0 /100 | #235 | Tragic 3.9% |
| Spanish Americans | 3.8 /100 | #236 | Tragic 3.9% |
| Immigrants | Trinidad and Tobago | 3.8 /100 | #237 | Tragic 3.9% |
| Colville | 2.6 /100 | #238 | Tragic 3.8% |
| British West Indians | 2.4 /100 | #239 | Tragic 3.8% |
| Immigrants | Ecuador | 2.3 /100 | #240 | Tragic 3.8% |
| Alaskan Athabascans | 2.3 /100 | #241 | Tragic 3.8% |
| Native Hawaiians | 2.3 /100 | #242 | Tragic 3.8% |
| Guamanians/Chamorros | 2.2 /100 | #243 | Tragic 3.8% |
| Immigrants | Bahamas | 2.0 /100 | #244 | Tragic 3.8% |
| French American Indians | 1.7 /100 | #245 | Tragic 3.8% |
| Marshallese | 1.7 /100 | #246 | Tragic 3.8% |
| Guyanese | 1.6 /100 | #247 | Tragic 3.8% |
| Hmong | 1.6 /100 | #248 | Tragic 3.7% |
| Immigrants | Grenada | 1.5 /100 | #249 | Tragic 3.7% |
Demographics Similar to Menominee by Professional Degree
In terms of professional degree, the demographic groups most similar to Menominee are Dutch West Indian (3.1%, a difference of 0.10%), Creek (3.1%, a difference of 0.16%), Bangladeshi (3.1%, a difference of 0.37%), Immigrants from Cabo Verde (3.1%, a difference of 0.45%), and Kiowa (3.1%, a difference of 0.57%).
| Demographics | Rating | Rank | Professional Degree |
| Choctaw | 0.1 /100 | #319 | Tragic 3.2% |
| Seminole | 0.1 /100 | #320 | Tragic 3.2% |
| Tsimshian | 0.0 /100 | #321 | Tragic 3.2% |
| Hispanics or Latinos | 0.0 /100 | #322 | Tragic 3.2% |
| Inupiat | 0.0 /100 | #323 | Tragic 3.2% |
| Crow | 0.0 /100 | #324 | Tragic 3.2% |
| Yaqui | 0.0 /100 | #325 | Tragic 3.2% |
| Menominee | 0.0 /100 | #326 | Tragic 3.1% |
| Dutch West Indians | 0.0 /100 | #327 | Tragic 3.1% |
| Creek | 0.0 /100 | #328 | Tragic 3.1% |
| Bangladeshis | 0.0 /100 | #329 | Tragic 3.1% |
| Immigrants | Cabo Verde | 0.0 /100 | #330 | Tragic 3.1% |
| Kiowa | 0.0 /100 | #331 | Tragic 3.1% |
| Yakama | 0.0 /100 | #332 | Tragic 3.1% |
| Puget Sound Salish | 0.0 /100 | #333 | Tragic 3.1% |