Arapaho vs Yugoslavian Unemployment Among Ages 45 to 54 years
COMPARE
Arapaho
Yugoslavian
Unemployment Among Ages 45 to 54 years
Unemployment Among Ages 45 to 54 years Comparison
Arapaho
Yugoslavians
7.5%
UNEMPLOYMENT AMONG AGES 45 TO 54 YEARS
0.0/ 100
METRIC RATING
339th/ 347
METRIC RANK
4.1%
UNEMPLOYMENT AMONG AGES 45 TO 54 YEARS
100.0/ 100
METRIC RATING
22nd/ 347
METRIC RANK
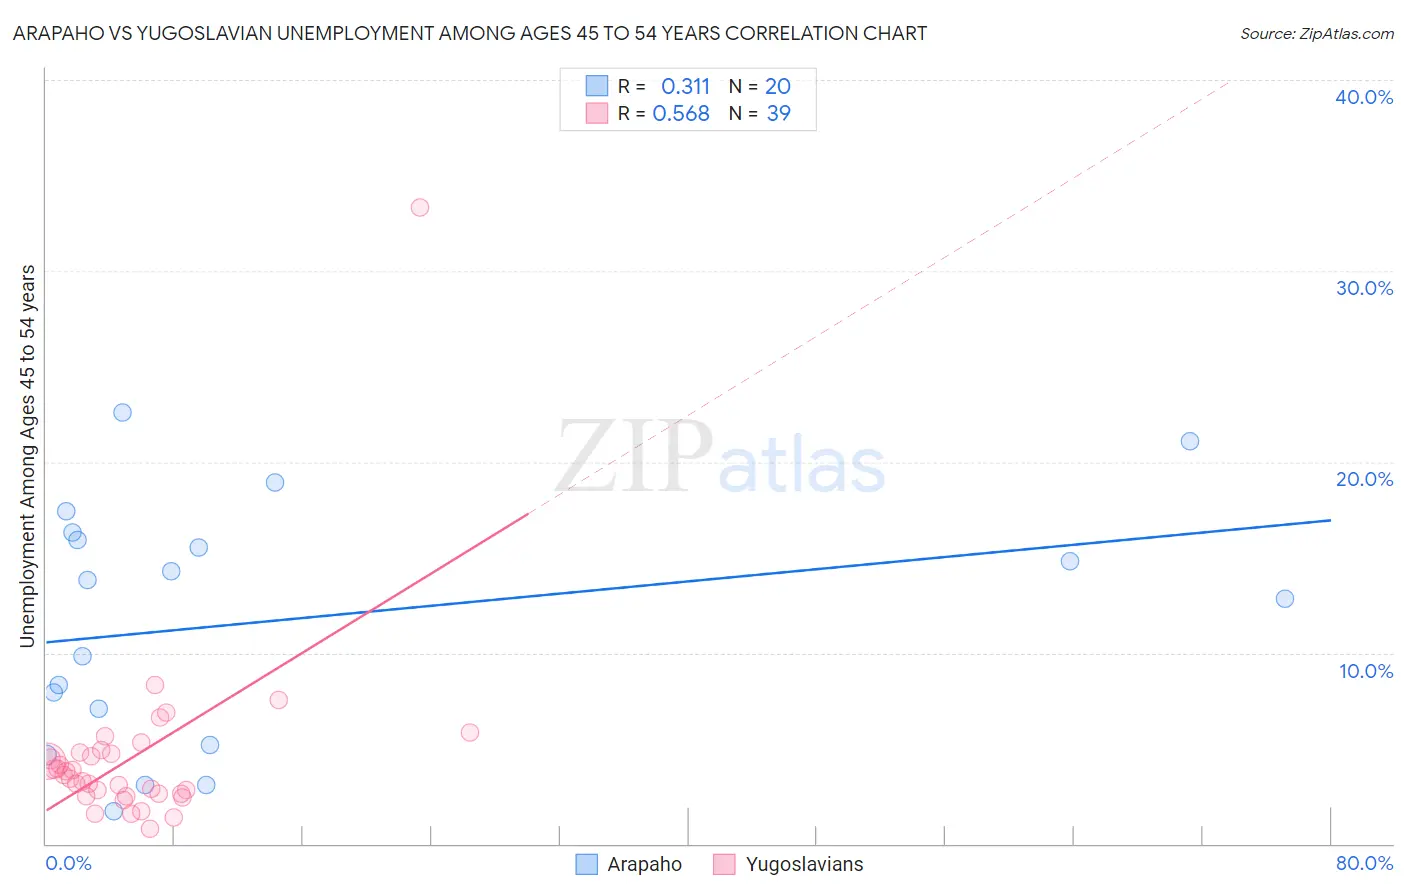
Arapaho vs Yugoslavian Unemployment Among Ages 45 to 54 years Correlation Chart
The statistical analysis conducted on geographies consisting of 29,598,134 people shows a mild positive correlation between the proportion of Arapaho and unemployment rate among population between the ages 45 and 54 in the United States with a correlation coefficient (R) of 0.311 and weighted average of 7.5%. Similarly, the statistical analysis conducted on geographies consisting of 280,013,183 people shows a substantial positive correlation between the proportion of Yugoslavians and unemployment rate among population between the ages 45 and 54 in the United States with a correlation coefficient (R) of 0.568 and weighted average of 4.1%, a difference of 83.0%.
Unemployment Among Ages 45 to 54 years Correlation Summary
| Measurement | Arapaho | Yugoslavian |
| Minimum | 1.7% | 0.80% |
| Maximum | 22.6% | 33.3% |
| Range | 20.9% | 32.5% |
| Mean | 11.7% | 4.5% |
| Median | 13.3% | 3.6% |
| Interquartile 25% (IQ1) | 6.1% | 2.6% |
| Interquartile 75% (IQ3) | 16.1% | 4.8% |
| Interquartile Range (IQR) | 10.0% | 2.2% |
| Standard Deviation (Sample) | 6.3% | 5.0% |
| Standard Deviation (Population) | 6.2% | 5.0% |
Similar Demographics by Unemployment Among Ages 45 to 54 years
Demographics Similar to Arapaho by Unemployment Among Ages 45 to 54 years
In terms of unemployment among ages 45 to 54 years, the demographic groups most similar to Arapaho are Hopi (7.5%, a difference of 0.46%), Colville (7.4%, a difference of 1.5%), Paiute (7.8%, a difference of 4.0%), Apache (7.0%, a difference of 6.5%), and Puerto Rican (6.8%, a difference of 10.1%).
| Demographics | Rating | Rank | Unemployment Among Ages 45 to 54 years |
| Pima | 0.0 /100 | #332 | Tragic 6.4% |
| Immigrants | Yemen | 0.0 /100 | #333 | Tragic 6.5% |
| Sioux | 0.0 /100 | #334 | Tragic 6.6% |
| Navajo | 0.0 /100 | #335 | Tragic 6.7% |
| Puerto Ricans | 0.0 /100 | #336 | Tragic 6.8% |
| Apache | 0.0 /100 | #337 | Tragic 7.0% |
| Colville | 0.0 /100 | #338 | Tragic 7.4% |
| Arapaho | 0.0 /100 | #339 | Tragic 7.5% |
| Hopi | 0.0 /100 | #340 | Tragic 7.5% |
| Paiute | 0.0 /100 | #341 | Tragic 7.8% |
| Alaskan Athabascans | 0.0 /100 | #342 | Tragic 8.5% |
| Inupiat | 0.0 /100 | #343 | Tragic 9.2% |
| Yuman | 0.0 /100 | #344 | Tragic 9.5% |
| Cheyenne | 0.0 /100 | #345 | Tragic 10.6% |
| Yup'ik | 0.0 /100 | #346 | Tragic 11.9% |
Demographics Similar to Yugoslavians by Unemployment Among Ages 45 to 54 years
In terms of unemployment among ages 45 to 54 years, the demographic groups most similar to Yugoslavians are Bulgarian (4.1%, a difference of 0.010%), European (4.1%, a difference of 0.090%), English (4.1%, a difference of 0.42%), Swiss (4.1%, a difference of 0.58%), and Carpatho Rusyn (4.1%, a difference of 0.66%).
| Demographics | Rating | Rank | Unemployment Among Ages 45 to 54 years |
| Immigrants | Bolivia | 100.0 /100 | #15 | Exceptional 4.0% |
| Thais | 100.0 /100 | #16 | Exceptional 4.0% |
| Tongans | 100.0 /100 | #17 | Exceptional 4.1% |
| Germans | 100.0 /100 | #18 | Exceptional 4.1% |
| Swiss | 100.0 /100 | #19 | Exceptional 4.1% |
| English | 100.0 /100 | #20 | Exceptional 4.1% |
| Europeans | 100.0 /100 | #21 | Exceptional 4.1% |
| Yugoslavians | 100.0 /100 | #22 | Exceptional 4.1% |
| Bulgarians | 100.0 /100 | #23 | Exceptional 4.1% |
| Carpatho Rusyns | 100.0 /100 | #24 | Exceptional 4.1% |
| Bolivians | 99.9 /100 | #25 | Exceptional 4.1% |
| Scottish | 99.9 /100 | #26 | Exceptional 4.1% |
| Immigrants | Moldova | 99.9 /100 | #27 | Exceptional 4.1% |
| Welsh | 99.9 /100 | #28 | Exceptional 4.1% |
| Belgians | 99.9 /100 | #29 | Exceptional 4.1% |