Jamaican vs Immigrants from Sudan Unemployment Among Ages 20 to 24 years
COMPARE
Jamaican
Immigrants from Sudan
Unemployment Among Ages 20 to 24 years
Unemployment Among Ages 20 to 24 years Comparison
Jamaicans
Immigrants from Sudan
12.6%
UNEMPLOYMENT AMONG AGES 20 TO 24 YEARS
0.0/ 100
METRIC RATING
310th/ 347
METRIC RANK
9.3%
UNEMPLOYMENT AMONG AGES 20 TO 24 YEARS
100.0/ 100
METRIC RATING
15th/ 347
METRIC RANK
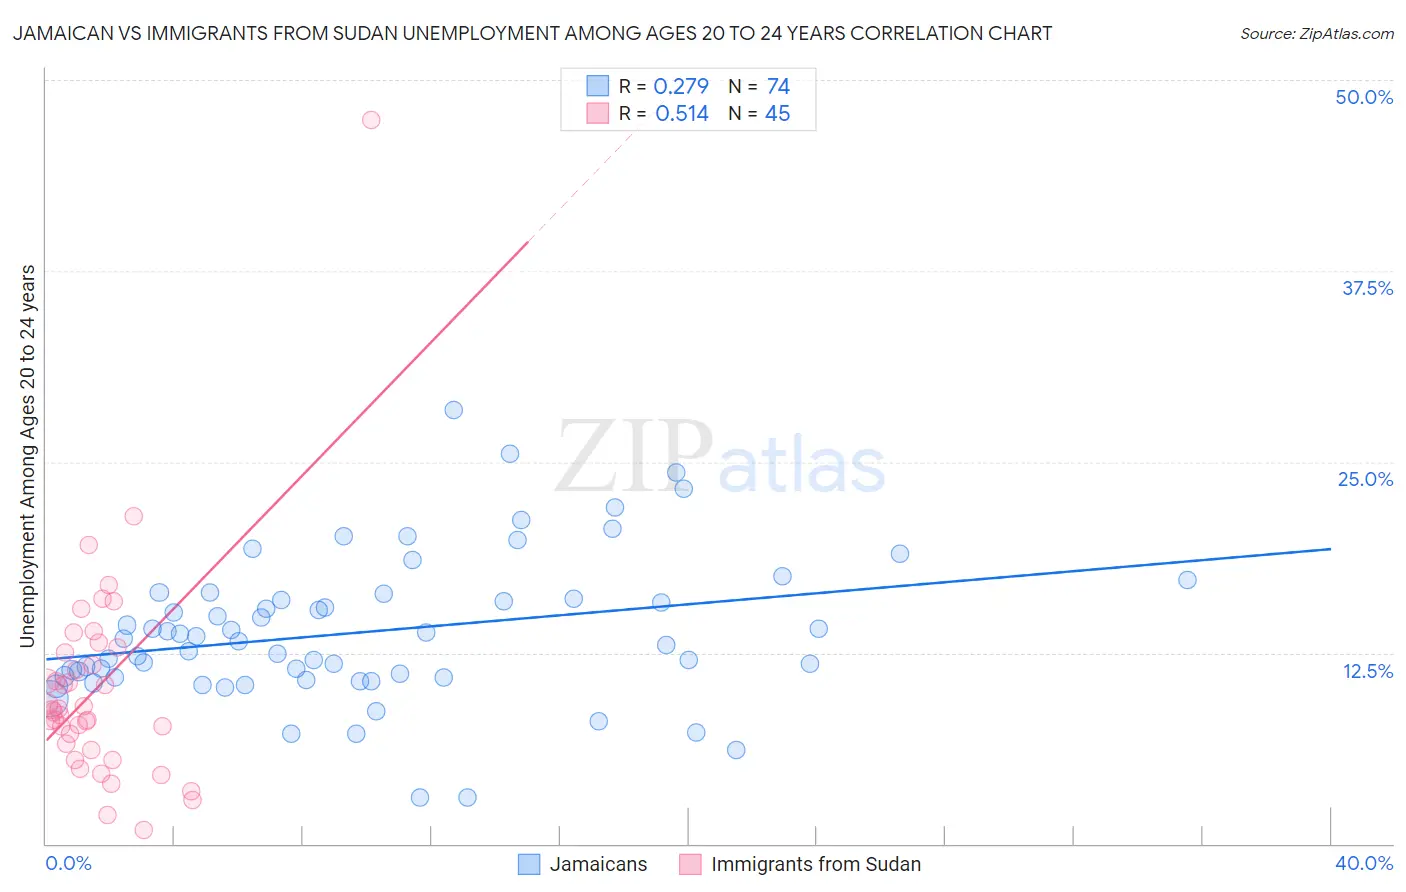
Jamaican vs Immigrants from Sudan Unemployment Among Ages 20 to 24 years Correlation Chart
The statistical analysis conducted on geographies consisting of 359,144,305 people shows a weak positive correlation between the proportion of Jamaicans and unemployment rate among population between the ages 20 and 24 in the United States with a correlation coefficient (R) of 0.279 and weighted average of 12.6%. Similarly, the statistical analysis conducted on geographies consisting of 118,369,819 people shows a substantial positive correlation between the proportion of Immigrants from Sudan and unemployment rate among population between the ages 20 and 24 in the United States with a correlation coefficient (R) of 0.514 and weighted average of 9.3%, a difference of 35.6%.
Unemployment Among Ages 20 to 24 years Correlation Summary
| Measurement | Jamaican | Immigrants from Sudan |
| Minimum | 3.0% | 0.90% |
| Maximum | 28.4% | 47.4% |
| Range | 25.4% | 46.5% |
| Mean | 13.9% | 10.2% |
| Median | 13.4% | 8.8% |
| Interquartile 25% (IQ1) | 10.9% | 6.4% |
| Interquartile 75% (IQ3) | 16.0% | 12.7% |
| Interquartile Range (IQR) | 5.1% | 6.3% |
| Standard Deviation (Sample) | 4.8% | 7.2% |
| Standard Deviation (Population) | 4.7% | 7.2% |
Similar Demographics by Unemployment Among Ages 20 to 24 years
Demographics Similar to Jamaicans by Unemployment Among Ages 20 to 24 years
In terms of unemployment among ages 20 to 24 years, the demographic groups most similar to Jamaicans are Immigrants from Bangladesh (12.6%, a difference of 0.12%), Tohono O'odham (12.5%, a difference of 0.20%), Vietnamese (12.6%, a difference of 0.44%), Houma (12.6%, a difference of 0.59%), and Bermudan (12.5%, a difference of 0.89%).
| Demographics | Rating | Rank | Unemployment Among Ages 20 to 24 years |
| Haitians | 0.0 /100 | #303 | Tragic 12.2% |
| Immigrants | West Indies | 0.0 /100 | #304 | Tragic 12.3% |
| Chippewa | 0.0 /100 | #305 | Tragic 12.3% |
| Immigrants | Haiti | 0.0 /100 | #306 | Tragic 12.4% |
| Bermudans | 0.0 /100 | #307 | Tragic 12.5% |
| Tohono O'odham | 0.0 /100 | #308 | Tragic 12.5% |
| Immigrants | Bangladesh | 0.0 /100 | #309 | Tragic 12.6% |
| Jamaicans | 0.0 /100 | #310 | Tragic 12.6% |
| Vietnamese | 0.0 /100 | #311 | Tragic 12.6% |
| Houma | 0.0 /100 | #312 | Tragic 12.6% |
| Shoshone | 0.0 /100 | #313 | Tragic 12.7% |
| Blacks/African Americans | 0.0 /100 | #314 | Tragic 12.7% |
| West Indians | 0.0 /100 | #315 | Tragic 12.8% |
| Immigrants | Dominica | 0.0 /100 | #316 | Tragic 12.8% |
| Immigrants | Trinidad and Tobago | 0.0 /100 | #317 | Tragic 12.8% |
Demographics Similar to Immigrants from Sudan by Unemployment Among Ages 20 to 24 years
In terms of unemployment among ages 20 to 24 years, the demographic groups most similar to Immigrants from Sudan are Slovene (9.3%, a difference of 0.030%), Danish (9.3%, a difference of 0.16%), Immigrants from Congo (9.2%, a difference of 0.41%), Cuban (9.2%, a difference of 0.49%), and Zimbabwean (9.2%, a difference of 0.60%).
| Demographics | Rating | Rank | Unemployment Among Ages 20 to 24 years |
| Somalis | 100.0 /100 | #8 | Exceptional 9.1% |
| Immigrants | Somalia | 100.0 /100 | #9 | Exceptional 9.2% |
| Sudanese | 100.0 /100 | #10 | Exceptional 9.2% |
| Zimbabweans | 100.0 /100 | #11 | Exceptional 9.2% |
| Cubans | 100.0 /100 | #12 | Exceptional 9.2% |
| Immigrants | Congo | 100.0 /100 | #13 | Exceptional 9.2% |
| Slovenes | 100.0 /100 | #14 | Exceptional 9.3% |
| Immigrants | Sudan | 100.0 /100 | #15 | Exceptional 9.3% |
| Danes | 100.0 /100 | #16 | Exceptional 9.3% |
| Czechs | 100.0 /100 | #17 | Exceptional 9.3% |
| Chinese | 100.0 /100 | #18 | Exceptional 9.4% |
| Hmong | 100.0 /100 | #19 | Exceptional 9.4% |
| Osage | 100.0 /100 | #20 | Exceptional 9.4% |
| Immigrants | Bosnia and Herzegovina | 100.0 /100 | #21 | Exceptional 9.4% |
| Tongans | 100.0 /100 | #22 | Exceptional 9.4% |