Moroccan vs Immigrants from Nicaragua Unemployment Among Ages 20 to 24 years
COMPARE
Moroccan
Immigrants from Nicaragua
Unemployment Among Ages 20 to 24 years
Unemployment Among Ages 20 to 24 years Comparison
Moroccans
Immigrants from Nicaragua
10.7%
UNEMPLOYMENT AMONG AGES 20 TO 24 YEARS
1.4/ 100
METRIC RATING
242nd/ 347
METRIC RANK
9.7%
UNEMPLOYMENT AMONG AGES 20 TO 24 YEARS
99.8/ 100
METRIC RATING
46th/ 347
METRIC RANK
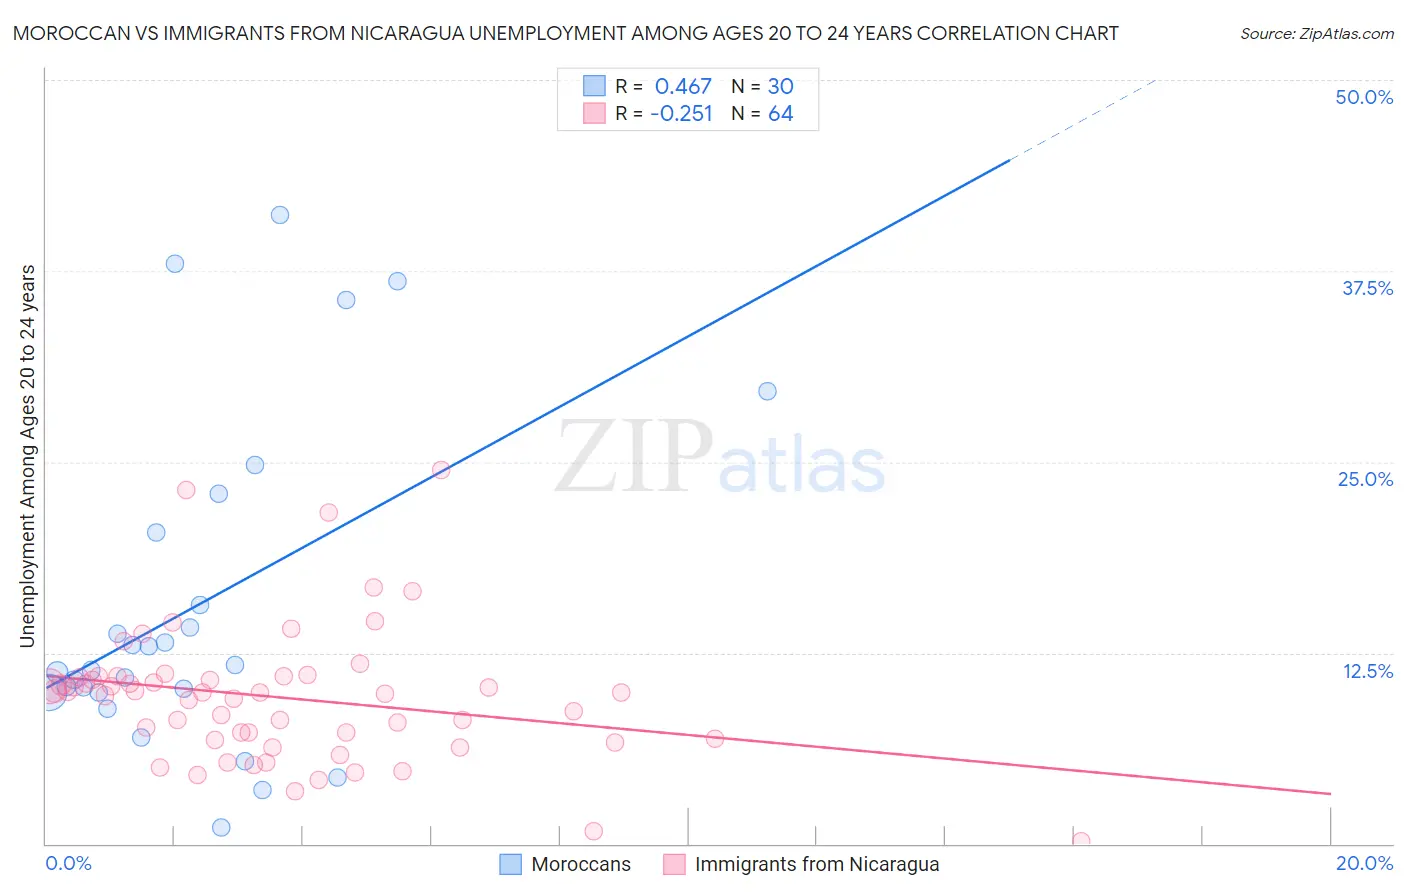
Moroccan vs Immigrants from Nicaragua Unemployment Among Ages 20 to 24 years Correlation Chart
The statistical analysis conducted on geographies consisting of 199,384,501 people shows a moderate positive correlation between the proportion of Moroccans and unemployment rate among population between the ages 20 and 24 in the United States with a correlation coefficient (R) of 0.467 and weighted average of 10.7%. Similarly, the statistical analysis conducted on geographies consisting of 233,235,115 people shows a weak negative correlation between the proportion of Immigrants from Nicaragua and unemployment rate among population between the ages 20 and 24 in the United States with a correlation coefficient (R) of -0.251 and weighted average of 9.7%, a difference of 10.3%.
Unemployment Among Ages 20 to 24 years Correlation Summary
| Measurement | Moroccan | Immigrants from Nicaragua |
| Minimum | 1.1% | 0.20% |
| Maximum | 41.2% | 24.5% |
| Range | 40.1% | 24.3% |
| Mean | 15.6% | 9.6% |
| Median | 11.5% | 9.9% |
| Interquartile 25% (IQ1) | 9.9% | 6.8% |
| Interquartile 75% (IQ3) | 20.4% | 10.9% |
| Interquartile Range (IQR) | 10.5% | 4.1% |
| Standard Deviation (Sample) | 10.7% | 4.5% |
| Standard Deviation (Population) | 10.6% | 4.4% |
Similar Demographics by Unemployment Among Ages 20 to 24 years
Demographics Similar to Moroccans by Unemployment Among Ages 20 to 24 years
In terms of unemployment among ages 20 to 24 years, the demographic groups most similar to Moroccans are Immigrants from Belarus (10.7%, a difference of 0.040%), Immigrants from Mexico (10.7%, a difference of 0.10%), Immigrants from El Salvador (10.7%, a difference of 0.17%), Hispanic or Latino (10.7%, a difference of 0.29%), and Immigrants from Central America (10.7%, a difference of 0.31%).
| Demographics | Rating | Rank | Unemployment Among Ages 20 to 24 years |
| Immigrants | Ukraine | 3.3 /100 | #235 | Tragic 10.6% |
| Mexicans | 3.2 /100 | #236 | Tragic 10.6% |
| Immigrants | Immigrants | 2.7 /100 | #237 | Tragic 10.6% |
| Immigrants | Pakistan | 2.6 /100 | #238 | Tragic 10.6% |
| Salvadorans | 2.4 /100 | #239 | Tragic 10.7% |
| Immigrants | Central America | 2.0 /100 | #240 | Tragic 10.7% |
| Immigrants | El Salvador | 1.7 /100 | #241 | Tragic 10.7% |
| Moroccans | 1.4 /100 | #242 | Tragic 10.7% |
| Immigrants | Belarus | 1.3 /100 | #243 | Tragic 10.7% |
| Immigrants | Mexico | 1.2 /100 | #244 | Tragic 10.7% |
| Hispanics or Latinos | 1.0 /100 | #245 | Tragic 10.7% |
| Immigrants | Iran | 0.9 /100 | #246 | Tragic 10.8% |
| Immigrants | Albania | 0.7 /100 | #247 | Tragic 10.8% |
| Cree | 0.6 /100 | #248 | Tragic 10.8% |
| South American Indians | 0.5 /100 | #249 | Tragic 10.8% |
Demographics Similar to Immigrants from Nicaragua by Unemployment Among Ages 20 to 24 years
In terms of unemployment among ages 20 to 24 years, the demographic groups most similar to Immigrants from Nicaragua are Croatian (9.7%, a difference of 0.010%), European (9.7%, a difference of 0.070%), Immigrants from India (9.7%, a difference of 0.12%), Finnish (9.7%, a difference of 0.13%), and Menominee (9.7%, a difference of 0.20%).
| Demographics | Rating | Rank | Unemployment Among Ages 20 to 24 years |
| Dutch | 99.9 /100 | #39 | Exceptional 9.6% |
| Immigrants | Ethiopia | 99.9 /100 | #40 | Exceptional 9.6% |
| Swiss | 99.9 /100 | #41 | Exceptional 9.7% |
| Immigrants | Saudi Arabia | 99.9 /100 | #42 | Exceptional 9.7% |
| Menominee | 99.8 /100 | #43 | Exceptional 9.7% |
| Europeans | 99.8 /100 | #44 | Exceptional 9.7% |
| Croatians | 99.8 /100 | #45 | Exceptional 9.7% |
| Immigrants | Nicaragua | 99.8 /100 | #46 | Exceptional 9.7% |
| Immigrants | India | 99.8 /100 | #47 | Exceptional 9.7% |
| Finns | 99.8 /100 | #48 | Exceptional 9.7% |
| Creek | 99.8 /100 | #49 | Exceptional 9.7% |
| Immigrants | Kenya | 99.7 /100 | #50 | Exceptional 9.7% |
| Ethiopians | 99.7 /100 | #51 | Exceptional 9.8% |
| Immigrants | Thailand | 99.7 /100 | #52 | Exceptional 9.8% |
| Immigrants | Serbia | 99.6 /100 | #53 | Exceptional 9.8% |