Mongolian vs Immigrants from Sweden Unemployment
COMPARE
Mongolian
Immigrants from Sweden
Unemployment
Unemployment Comparison
Mongolians
Immigrants from Sweden
5.0%
UNEMPLOYMENT
94.8/ 100
METRIC RATING
99th/ 347
METRIC RANK
5.0%
UNEMPLOYMENT
97.6/ 100
METRIC RATING
80th/ 347
METRIC RANK
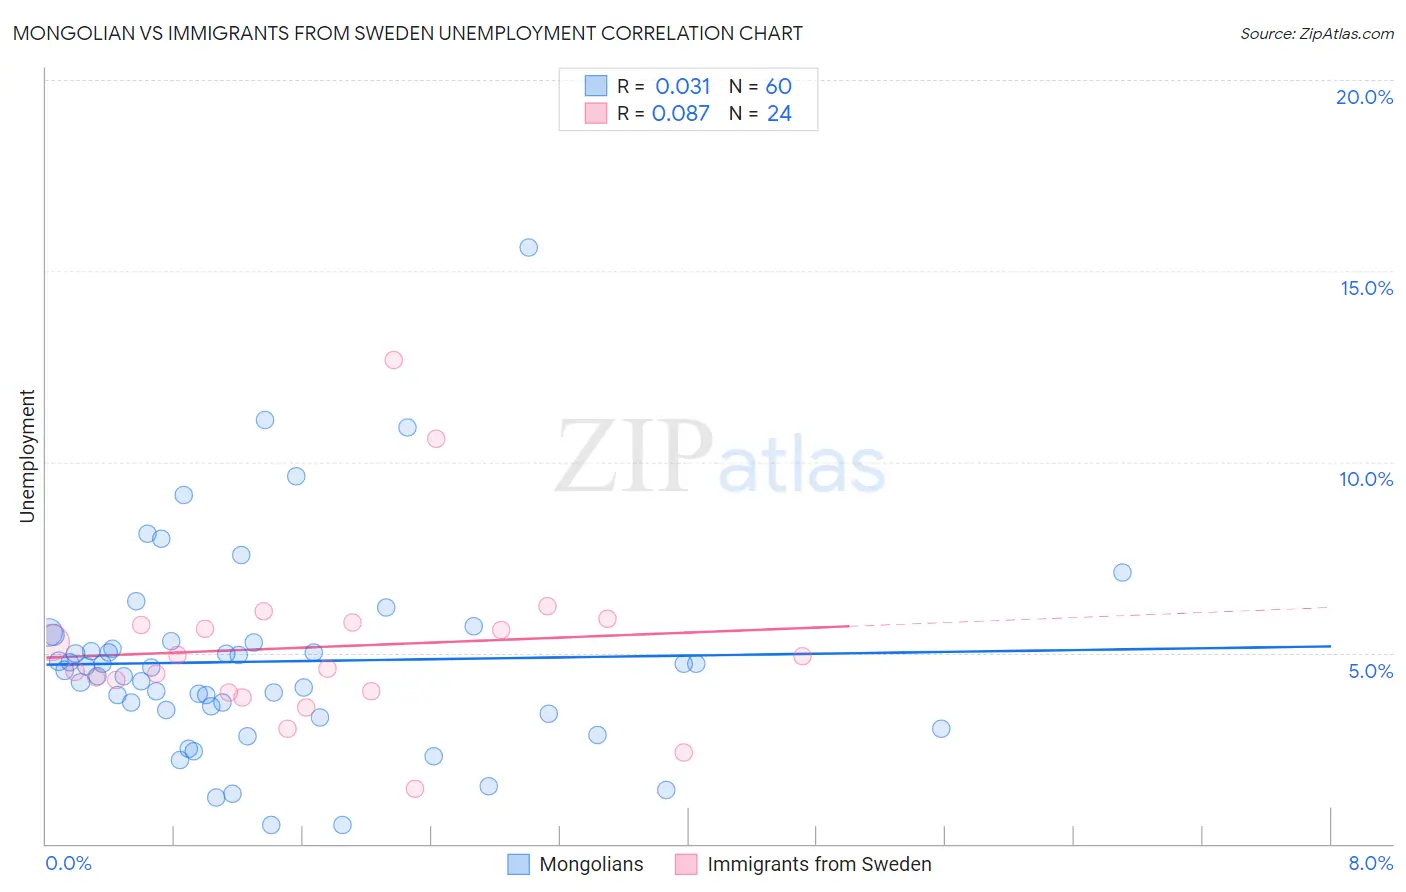
Mongolian vs Immigrants from Sweden Unemployment Correlation Chart
The statistical analysis conducted on geographies consisting of 140,354,726 people shows no correlation between the proportion of Mongolians and unemployment in the United States with a correlation coefficient (R) of 0.031 and weighted average of 5.0%. Similarly, the statistical analysis conducted on geographies consisting of 164,697,835 people shows a slight positive correlation between the proportion of Immigrants from Sweden and unemployment in the United States with a correlation coefficient (R) of 0.087 and weighted average of 5.0%, a difference of 1.3%.
Unemployment Correlation Summary
| Measurement | Mongolian | Immigrants from Sweden |
| Minimum | 0.50% | 1.5% |
| Maximum | 15.6% | 12.7% |
| Range | 15.1% | 11.2% |
| Mean | 4.8% | 5.2% |
| Median | 4.6% | 4.7% |
| Interquartile 25% (IQ1) | 3.5% | 4.0% |
| Interquartile 75% (IQ3) | 5.3% | 5.8% |
| Interquartile Range (IQR) | 1.8% | 1.8% |
| Standard Deviation (Sample) | 2.6% | 2.3% |
| Standard Deviation (Population) | 2.6% | 2.3% |
Demographics Similar to Mongolians and Immigrants from Sweden by Unemployment
In terms of unemployment, the demographic groups most similar to Mongolians are Romanian (5.0%, a difference of 0.070%), Immigrants from Czechoslovakia (5.0%, a difference of 0.10%), Immigrants from England (5.0%, a difference of 0.13%), Immigrants from Serbia (5.0%, a difference of 0.30%), and Immigrants from Austria (5.0%, a difference of 0.43%). Similarly, the demographic groups most similar to Immigrants from Sweden are Basque (5.0%, a difference of 0.010%), Fijian (5.0%, a difference of 0.020%), Hmong (5.0%, a difference of 0.030%), Canadian (5.0%, a difference of 0.070%), and Russian (5.0%, a difference of 0.11%).
| Demographics | Rating | Rank | Unemployment |
| Canadians | 97.7 /100 | #79 | Exceptional 5.0% |
| Immigrants | Sweden | 97.6 /100 | #80 | Exceptional 5.0% |
| Basques | 97.6 /100 | #81 | Exceptional 5.0% |
| Fijians | 97.6 /100 | #82 | Exceptional 5.0% |
| Hmong | 97.6 /100 | #83 | Exceptional 5.0% |
| Russians | 97.4 /100 | #84 | Exceptional 5.0% |
| Immigrants | Australia | 97.0 /100 | #85 | Exceptional 5.0% |
| Hungarians | 96.9 /100 | #86 | Exceptional 5.0% |
| Immigrants | Moldova | 96.6 /100 | #87 | Exceptional 5.0% |
| Immigrants | Korea | 96.6 /100 | #88 | Exceptional 5.0% |
| Jordanians | 96.4 /100 | #89 | Exceptional 5.0% |
| Immigrants | North Macedonia | 96.3 /100 | #90 | Exceptional 5.0% |
| Immigrants | Sudan | 96.3 /100 | #91 | Exceptional 5.0% |
| Immigrants | South Africa | 96.2 /100 | #92 | Exceptional 5.0% |
| Ukrainians | 96.0 /100 | #93 | Exceptional 5.0% |
| Immigrants | Austria | 95.9 /100 | #94 | Exceptional 5.0% |
| Immigrants | Serbia | 95.6 /100 | #95 | Exceptional 5.0% |
| Immigrants | England | 95.2 /100 | #96 | Exceptional 5.0% |
| Immigrants | Czechoslovakia | 95.1 /100 | #97 | Exceptional 5.0% |
| Romanians | 95.0 /100 | #98 | Exceptional 5.0% |
| Mongolians | 94.8 /100 | #99 | Exceptional 5.0% |