Mongolian vs Arapaho Unemployment
COMPARE
Mongolian
Arapaho
Unemployment
Unemployment Comparison
Mongolians
Arapaho
5.0%
UNEMPLOYMENT
94.8/ 100
METRIC RATING
99th/ 347
METRIC RANK
9.8%
UNEMPLOYMENT
0.0/ 100
METRIC RATING
344th/ 347
METRIC RANK
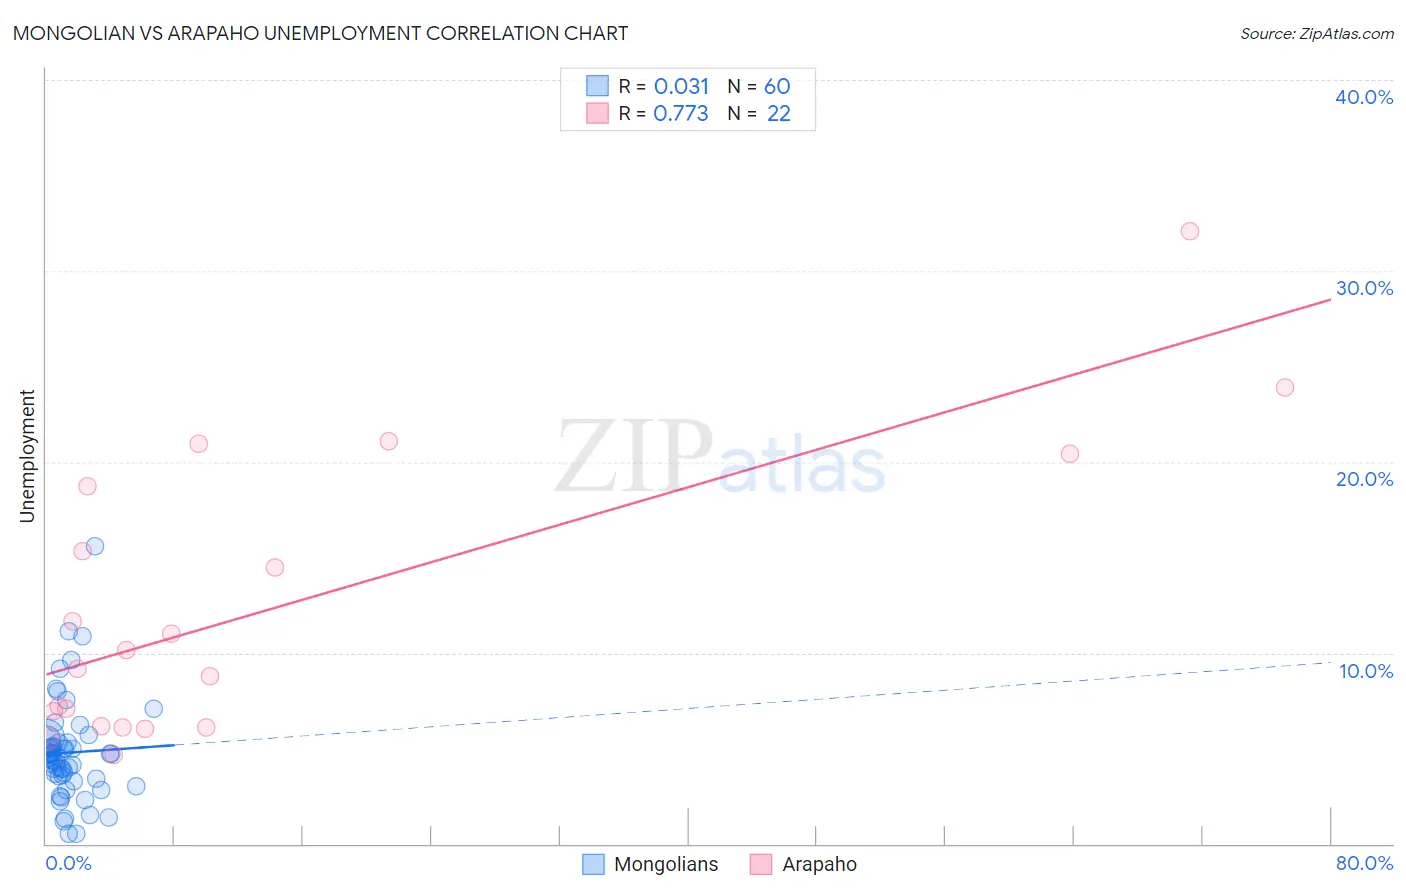
Mongolian vs Arapaho Unemployment Correlation Chart
The statistical analysis conducted on geographies consisting of 140,354,726 people shows no correlation between the proportion of Mongolians and unemployment in the United States with a correlation coefficient (R) of 0.031 and weighted average of 5.0%. Similarly, the statistical analysis conducted on geographies consisting of 29,773,692 people shows a strong positive correlation between the proportion of Arapaho and unemployment in the United States with a correlation coefficient (R) of 0.773 and weighted average of 9.8%, a difference of 95.6%.
Unemployment Correlation Summary
| Measurement | Mongolian | Arapaho |
| Minimum | 0.50% | 4.7% |
| Maximum | 15.6% | 32.1% |
| Range | 15.1% | 27.4% |
| Mean | 4.8% | 12.4% |
| Median | 4.6% | 9.7% |
| Interquartile 25% (IQ1) | 3.5% | 6.2% |
| Interquartile 75% (IQ3) | 5.3% | 18.7% |
| Interquartile Range (IQR) | 1.8% | 12.5% |
| Standard Deviation (Sample) | 2.6% | 7.5% |
| Standard Deviation (Population) | 2.6% | 7.3% |
Similar Demographics by Unemployment
Demographics Similar to Mongolians by Unemployment
In terms of unemployment, the demographic groups most similar to Mongolians are Estonian (5.0%, a difference of 0.060%), Romanian (5.0%, a difference of 0.070%), Immigrants from Czechoslovakia (5.0%, a difference of 0.10%), Immigrants from England (5.0%, a difference of 0.13%), and American (5.0%, a difference of 0.15%).
| Demographics | Rating | Rank | Unemployment |
| Immigrants | South Africa | 96.2 /100 | #92 | Exceptional 5.0% |
| Ukrainians | 96.0 /100 | #93 | Exceptional 5.0% |
| Immigrants | Austria | 95.9 /100 | #94 | Exceptional 5.0% |
| Immigrants | Serbia | 95.6 /100 | #95 | Exceptional 5.0% |
| Immigrants | England | 95.2 /100 | #96 | Exceptional 5.0% |
| Immigrants | Czechoslovakia | 95.1 /100 | #97 | Exceptional 5.0% |
| Romanians | 95.0 /100 | #98 | Exceptional 5.0% |
| Mongolians | 94.8 /100 | #99 | Exceptional 5.0% |
| Estonians | 94.6 /100 | #100 | Exceptional 5.0% |
| Americans | 94.3 /100 | #101 | Exceptional 5.0% |
| Immigrants | Argentina | 94.1 /100 | #102 | Exceptional 5.0% |
| Chickasaw | 94.0 /100 | #103 | Exceptional 5.0% |
| Osage | 94.0 /100 | #104 | Exceptional 5.0% |
| Maltese | 94.0 /100 | #105 | Exceptional 5.0% |
| Immigrants | Romania | 93.7 /100 | #106 | Exceptional 5.0% |
Demographics Similar to Arapaho by Unemployment
In terms of unemployment, the demographic groups most similar to Arapaho are Inupiat (10.1%, a difference of 2.9%), Yuman (9.1%, a difference of 8.4%), Hopi (8.9%, a difference of 10.2%), Tohono O'odham (8.9%, a difference of 10.7%), and Crow (11.1%, a difference of 12.6%).
| Demographics | Rating | Rank | Unemployment |
| Immigrants | Dominican Republic | 0.0 /100 | #333 | Tragic 7.4% |
| Apache | 0.0 /100 | #334 | Tragic 7.4% |
| Alaskan Athabascans | 0.0 /100 | #335 | Tragic 7.7% |
| Immigrants | Yemen | 0.0 /100 | #336 | Tragic 7.7% |
| Cheyenne | 0.0 /100 | #337 | Tragic 8.0% |
| Pima | 0.0 /100 | #338 | Tragic 8.2% |
| Navajo | 0.0 /100 | #339 | Tragic 8.4% |
| Puerto Ricans | 0.0 /100 | #340 | Tragic 8.4% |
| Tohono O'odham | 0.0 /100 | #341 | Tragic 8.9% |
| Hopi | 0.0 /100 | #342 | Tragic 8.9% |
| Yuman | 0.0 /100 | #343 | Tragic 9.1% |
| Arapaho | 0.0 /100 | #344 | Tragic 9.8% |
| Inupiat | 0.0 /100 | #345 | Tragic 10.1% |
| Crow | 0.0 /100 | #346 | Tragic 11.1% |
| Yup'ik | 0.0 /100 | #347 | Tragic 13.6% |