Mexican American Indian vs Jamaican Unemployment Among Women with Children Ages 6 to 17 years
COMPARE
Mexican American Indian
Jamaican
Unemployment Among Women with Children Ages 6 to 17 years
Unemployment Among Women with Children Ages 6 to 17 years Comparison
Mexican American Indians
Jamaicans
8.9%
UNEMPLOYMENT AMONG WOMEN WITH CHILDREN AGES 6 TO 17 YEARS
60.6/ 100
METRIC RATING
163rd/ 347
METRIC RANK
9.8%
UNEMPLOYMENT AMONG WOMEN WITH CHILDREN AGES 6 TO 17 YEARS
0.0/ 100
METRIC RATING
281st/ 347
METRIC RANK
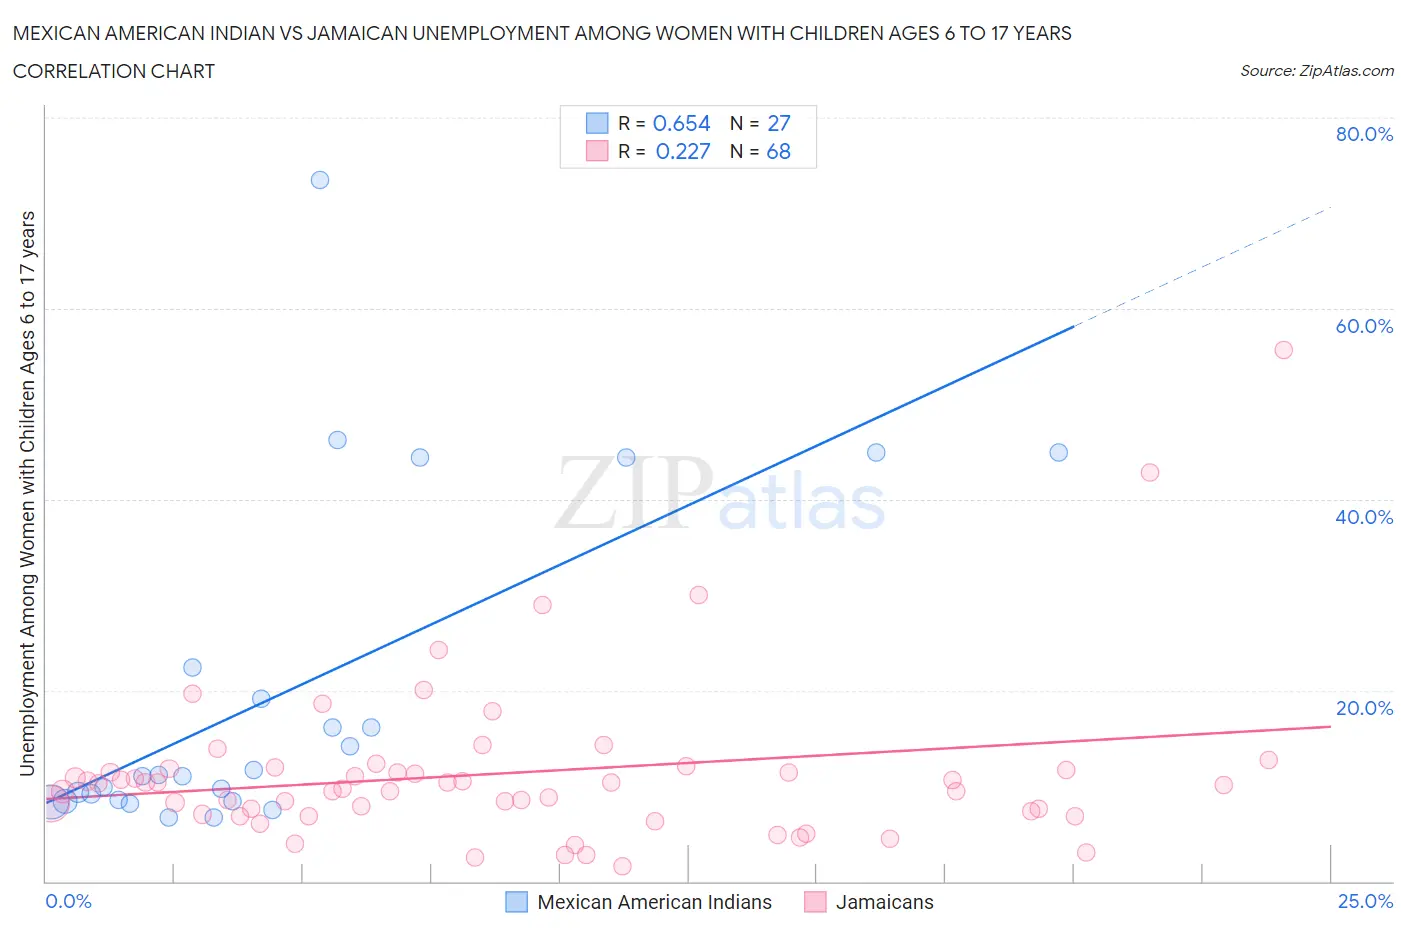
Mexican American Indian vs Jamaican Unemployment Among Women with Children Ages 6 to 17 years Correlation Chart
The statistical analysis conducted on geographies consisting of 246,437,451 people shows a significant positive correlation between the proportion of Mexican American Indians and unemployment rate among women with children between the ages 6 and 17 in the United States with a correlation coefficient (R) of 0.654 and weighted average of 8.9%. Similarly, the statistical analysis conducted on geographies consisting of 272,557,643 people shows a weak positive correlation between the proportion of Jamaicans and unemployment rate among women with children between the ages 6 and 17 in the United States with a correlation coefficient (R) of 0.227 and weighted average of 9.8%, a difference of 9.5%.
Unemployment Among Women with Children Ages 6 to 17 years Correlation Summary
| Measurement | Mexican American Indian | Jamaican |
| Minimum | 6.6% | 1.6% |
| Maximum | 73.5% | 55.7% |
| Range | 66.9% | 54.1% |
| Mean | 19.7% | 11.3% |
| Median | 11.0% | 10.2% |
| Interquartile 25% (IQ1) | 8.4% | 7.2% |
| Interquartile 75% (IQ3) | 22.4% | 11.8% |
| Interquartile Range (IQR) | 14.0% | 4.6% |
| Standard Deviation (Sample) | 17.5% | 8.6% |
| Standard Deviation (Population) | 17.2% | 8.6% |
Similar Demographics by Unemployment Among Women with Children Ages 6 to 17 years
Demographics Similar to Mexican American Indians by Unemployment Among Women with Children Ages 6 to 17 years
In terms of unemployment among women with children ages 6 to 17 years, the demographic groups most similar to Mexican American Indians are Immigrants from Netherlands (8.9%, a difference of 0.010%), Ukrainian (8.9%, a difference of 0.040%), Immigrants from Micronesia (8.9%, a difference of 0.060%), Moroccan (8.9%, a difference of 0.10%), and Immigrants from Guyana (8.9%, a difference of 0.11%).
| Demographics | Rating | Rank | Unemployment Among Women with Children Ages 6 to 17 years |
| Osage | 65.9 /100 | #156 | Good 8.9% |
| Immigrants | Belgium | 65.6 /100 | #157 | Good 8.9% |
| Immigrants | Chile | 65.3 /100 | #158 | Good 8.9% |
| Spanish | 63.8 /100 | #159 | Good 8.9% |
| Immigrants | Hungary | 63.4 /100 | #160 | Good 8.9% |
| Immigrants | Guyana | 63.0 /100 | #161 | Good 8.9% |
| Immigrants | Netherlands | 60.8 /100 | #162 | Good 8.9% |
| Mexican American Indians | 60.6 /100 | #163 | Good 8.9% |
| Ukrainians | 59.7 /100 | #164 | Average 8.9% |
| Immigrants | Micronesia | 59.2 /100 | #165 | Average 8.9% |
| Moroccans | 58.3 /100 | #166 | Average 8.9% |
| Immigrants | England | 57.7 /100 | #167 | Average 8.9% |
| Immigrants | Croatia | 57.1 /100 | #168 | Average 8.9% |
| British | 55.2 /100 | #169 | Average 8.9% |
| Turks | 54.1 /100 | #170 | Average 8.9% |
Demographics Similar to Jamaicans by Unemployment Among Women with Children Ages 6 to 17 years
In terms of unemployment among women with children ages 6 to 17 years, the demographic groups most similar to Jamaicans are Slovak (9.8%, a difference of 0.23%), Seminole (9.7%, a difference of 0.53%), Scotch-Irish (9.7%, a difference of 0.72%), French (9.7%, a difference of 0.75%), and British West Indian (9.7%, a difference of 0.82%).
| Demographics | Rating | Rank | Unemployment Among Women with Children Ages 6 to 17 years |
| Aleuts | 0.1 /100 | #274 | Tragic 9.6% |
| U.S. Virgin Islanders | 0.1 /100 | #275 | Tragic 9.7% |
| Immigrants | Portugal | 0.1 /100 | #276 | Tragic 9.7% |
| British West Indians | 0.1 /100 | #277 | Tragic 9.7% |
| French | 0.1 /100 | #278 | Tragic 9.7% |
| Scotch-Irish | 0.1 /100 | #279 | Tragic 9.7% |
| Seminole | 0.1 /100 | #280 | Tragic 9.7% |
| Jamaicans | 0.0 /100 | #281 | Tragic 9.8% |
| Slovaks | 0.0 /100 | #282 | Tragic 9.8% |
| Central American Indians | 0.0 /100 | #283 | Tragic 9.9% |
| Yakama | 0.0 /100 | #284 | Tragic 9.9% |
| Hispanics or Latinos | 0.0 /100 | #285 | Tragic 9.9% |
| Choctaw | 0.0 /100 | #286 | Tragic 9.9% |
| Sierra Leoneans | 0.0 /100 | #287 | Tragic 9.9% |
| Shoshone | 0.0 /100 | #288 | Tragic 10.0% |