Mexican American Indian vs Palestinian Unemployment Among Women with Children Ages 6 to 17 years
COMPARE
Mexican American Indian
Palestinian
Unemployment Among Women with Children Ages 6 to 17 years
Unemployment Among Women with Children Ages 6 to 17 years Comparison
Mexican American Indians
Palestinians
8.9%
UNEMPLOYMENT AMONG WOMEN WITH CHILDREN AGES 6 TO 17 YEARS
60.6/ 100
METRIC RATING
163rd/ 347
METRIC RANK
9.0%
UNEMPLOYMENT AMONG WOMEN WITH CHILDREN AGES 6 TO 17 YEARS
33.4/ 100
METRIC RATING
184th/ 347
METRIC RANK
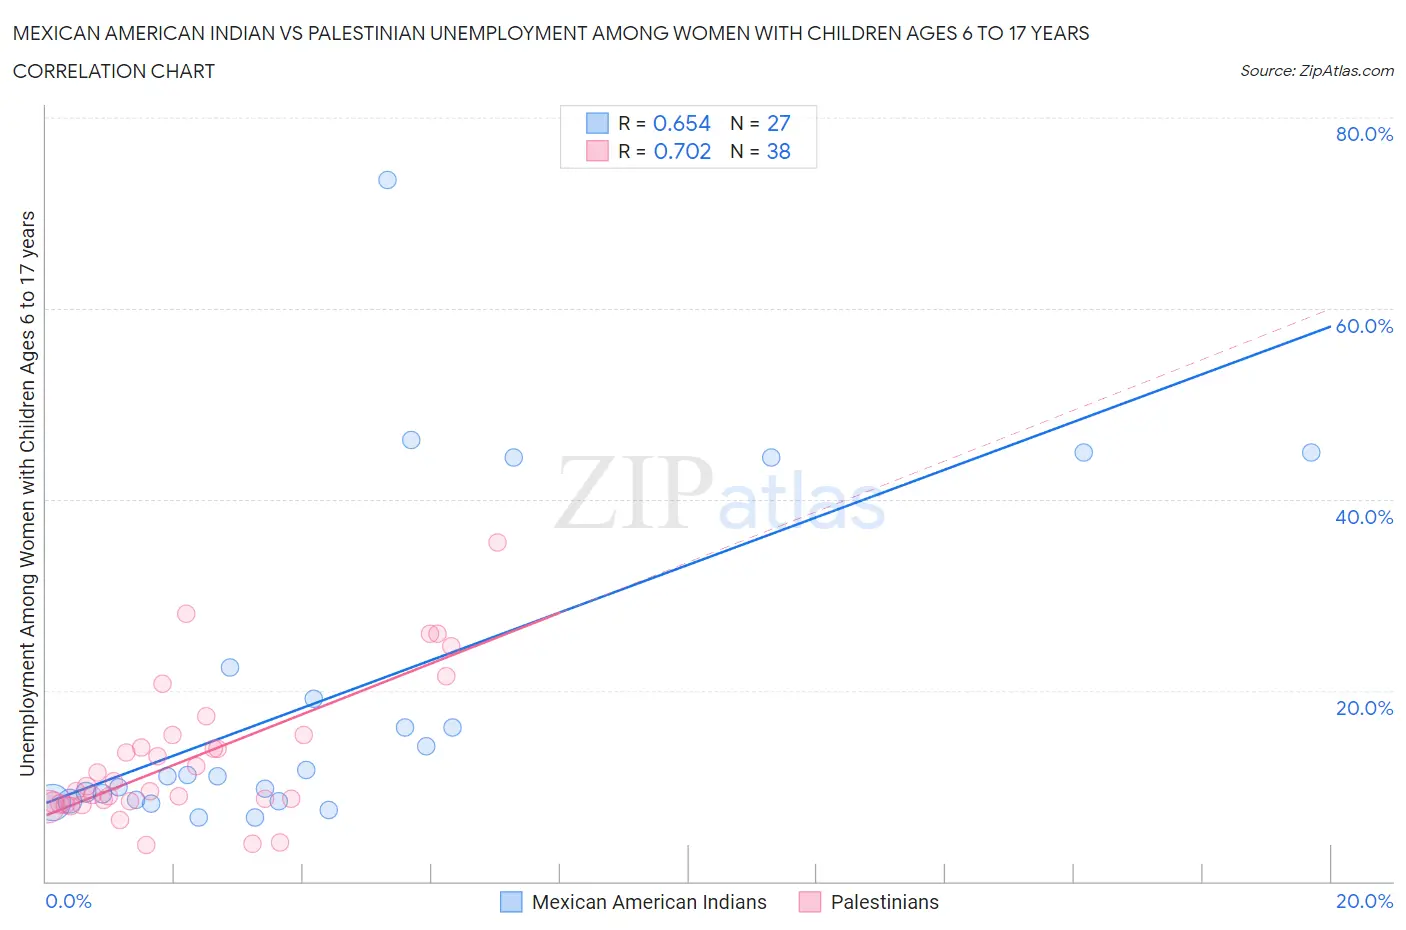
Mexican American Indian vs Palestinian Unemployment Among Women with Children Ages 6 to 17 years Correlation Chart
The statistical analysis conducted on geographies consisting of 246,437,451 people shows a significant positive correlation between the proportion of Mexican American Indians and unemployment rate among women with children between the ages 6 and 17 in the United States with a correlation coefficient (R) of 0.654 and weighted average of 8.9%. Similarly, the statistical analysis conducted on geographies consisting of 174,381,840 people shows a strong positive correlation between the proportion of Palestinians and unemployment rate among women with children between the ages 6 and 17 in the United States with a correlation coefficient (R) of 0.702 and weighted average of 9.0%, a difference of 1.3%.
Unemployment Among Women with Children Ages 6 to 17 years Correlation Summary
| Measurement | Mexican American Indian | Palestinian |
| Minimum | 6.6% | 3.8% |
| Maximum | 73.5% | 35.5% |
| Range | 66.9% | 31.7% |
| Mean | 19.7% | 12.9% |
| Median | 11.0% | 9.7% |
| Interquartile 25% (IQ1) | 8.4% | 8.3% |
| Interquartile 75% (IQ3) | 22.4% | 15.3% |
| Interquartile Range (IQR) | 14.0% | 7.0% |
| Standard Deviation (Sample) | 17.5% | 7.3% |
| Standard Deviation (Population) | 17.2% | 7.2% |
Similar Demographics by Unemployment Among Women with Children Ages 6 to 17 years
Demographics Similar to Mexican American Indians by Unemployment Among Women with Children Ages 6 to 17 years
In terms of unemployment among women with children ages 6 to 17 years, the demographic groups most similar to Mexican American Indians are Immigrants from Netherlands (8.9%, a difference of 0.010%), Ukrainian (8.9%, a difference of 0.040%), Immigrants from Micronesia (8.9%, a difference of 0.060%), Moroccan (8.9%, a difference of 0.10%), and Immigrants from Guyana (8.9%, a difference of 0.11%).
| Demographics | Rating | Rank | Unemployment Among Women with Children Ages 6 to 17 years |
| Osage | 65.9 /100 | #156 | Good 8.9% |
| Immigrants | Belgium | 65.6 /100 | #157 | Good 8.9% |
| Immigrants | Chile | 65.3 /100 | #158 | Good 8.9% |
| Spanish | 63.8 /100 | #159 | Good 8.9% |
| Immigrants | Hungary | 63.4 /100 | #160 | Good 8.9% |
| Immigrants | Guyana | 63.0 /100 | #161 | Good 8.9% |
| Immigrants | Netherlands | 60.8 /100 | #162 | Good 8.9% |
| Mexican American Indians | 60.6 /100 | #163 | Good 8.9% |
| Ukrainians | 59.7 /100 | #164 | Average 8.9% |
| Immigrants | Micronesia | 59.2 /100 | #165 | Average 8.9% |
| Moroccans | 58.3 /100 | #166 | Average 8.9% |
| Immigrants | England | 57.7 /100 | #167 | Average 8.9% |
| Immigrants | Croatia | 57.1 /100 | #168 | Average 8.9% |
| British | 55.2 /100 | #169 | Average 8.9% |
| Turks | 54.1 /100 | #170 | Average 8.9% |
Demographics Similar to Palestinians by Unemployment Among Women with Children Ages 6 to 17 years
In terms of unemployment among women with children ages 6 to 17 years, the demographic groups most similar to Palestinians are Swiss (9.0%, a difference of 0.0%), Immigrants from Congo (9.0%, a difference of 0.040%), Immigrants from Czechoslovakia (9.0%, a difference of 0.050%), South American Indian (9.0%, a difference of 0.050%), and Immigrants from Spain (9.0%, a difference of 0.050%).
| Demographics | Rating | Rank | Unemployment Among Women with Children Ages 6 to 17 years |
| Immigrants | Jordan | 41.6 /100 | #177 | Average 9.0% |
| Menominee | 39.3 /100 | #178 | Fair 9.0% |
| Immigrants | Zaire | 38.3 /100 | #179 | Fair 9.0% |
| Ethiopians | 37.6 /100 | #180 | Fair 9.0% |
| Immigrants | Czechoslovakia | 34.5 /100 | #181 | Fair 9.0% |
| South American Indians | 34.4 /100 | #182 | Fair 9.0% |
| Swiss | 33.5 /100 | #183 | Fair 9.0% |
| Palestinians | 33.4 /100 | #184 | Fair 9.0% |
| Immigrants | Congo | 32.5 /100 | #185 | Fair 9.0% |
| Immigrants | Spain | 32.4 /100 | #186 | Fair 9.0% |
| Comanche | 30.0 /100 | #187 | Fair 9.0% |
| Immigrants | Syria | 29.7 /100 | #188 | Fair 9.1% |
| Immigrants | Immigrants | 29.2 /100 | #189 | Fair 9.1% |
| Slovenes | 28.5 /100 | #190 | Fair 9.1% |
| Belizeans | 28.4 /100 | #191 | Fair 9.1% |