European vs Jamaican Unemployment Among Women with Children Ages 6 to 17 years
COMPARE
European
Jamaican
Unemployment Among Women with Children Ages 6 to 17 years
Unemployment Among Women with Children Ages 6 to 17 years Comparison
Europeans
Jamaicans
8.7%
UNEMPLOYMENT AMONG WOMEN WITH CHILDREN AGES 6 TO 17 YEARS
90.6/ 100
METRIC RATING
135th/ 347
METRIC RANK
9.8%
UNEMPLOYMENT AMONG WOMEN WITH CHILDREN AGES 6 TO 17 YEARS
0.0/ 100
METRIC RATING
281st/ 347
METRIC RANK
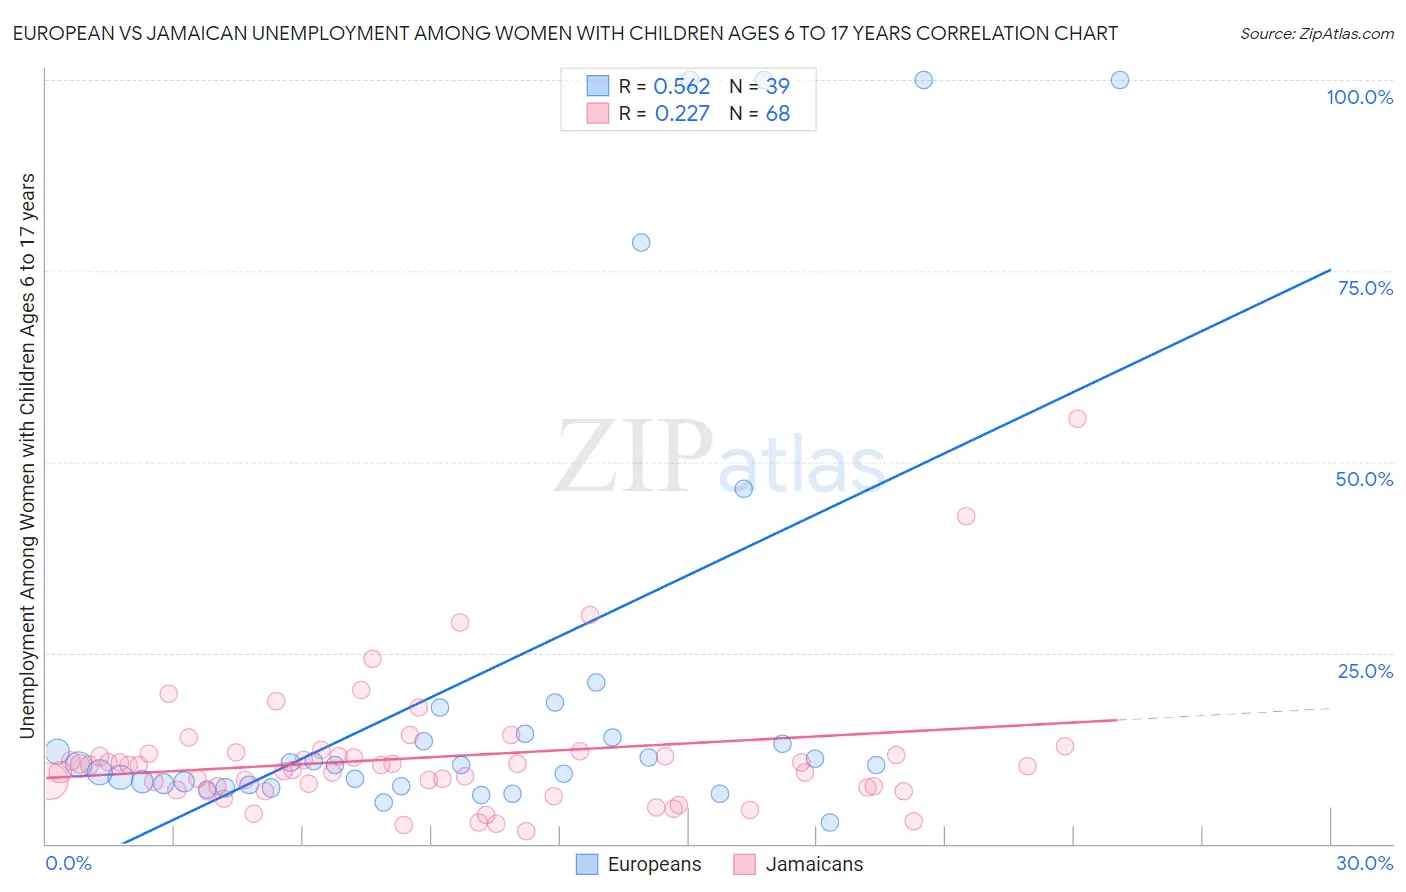
European vs Jamaican Unemployment Among Women with Children Ages 6 to 17 years Correlation Chart
The statistical analysis conducted on geographies consisting of 354,477,145 people shows a substantial positive correlation between the proportion of Europeans and unemployment rate among women with children between the ages 6 and 17 in the United States with a correlation coefficient (R) of 0.562 and weighted average of 8.7%. Similarly, the statistical analysis conducted on geographies consisting of 272,557,643 people shows a weak positive correlation between the proportion of Jamaicans and unemployment rate among women with children between the ages 6 and 17 in the United States with a correlation coefficient (R) of 0.227 and weighted average of 9.8%, a difference of 11.8%.
Unemployment Among Women with Children Ages 6 to 17 years Correlation Summary
| Measurement | European | Jamaican |
| Minimum | 2.8% | 1.6% |
| Maximum | 100.0% | 55.7% |
| Range | 97.2% | 54.1% |
| Mean | 22.0% | 11.3% |
| Median | 10.3% | 10.2% |
| Interquartile 25% (IQ1) | 7.7% | 7.2% |
| Interquartile 75% (IQ3) | 14.4% | 11.8% |
| Interquartile Range (IQR) | 6.7% | 4.6% |
| Standard Deviation (Sample) | 29.6% | 8.6% |
| Standard Deviation (Population) | 29.2% | 8.6% |
Similar Demographics by Unemployment Among Women with Children Ages 6 to 17 years
Demographics Similar to Europeans by Unemployment Among Women with Children Ages 6 to 17 years
In terms of unemployment among women with children ages 6 to 17 years, the demographic groups most similar to Europeans are Immigrants from Latvia (8.7%, a difference of 0.030%), Immigrants from Ireland (8.7%, a difference of 0.060%), Immigrants from Argentina (8.7%, a difference of 0.080%), Immigrants from Ethiopia (8.8%, a difference of 0.14%), and Egyptian (8.7%, a difference of 0.17%).
| Demographics | Rating | Rank | Unemployment Among Women with Children Ages 6 to 17 years |
| Hmong | 94.3 /100 | #128 | Exceptional 8.7% |
| Barbadians | 93.8 /100 | #129 | Exceptional 8.7% |
| Immigrants | Western Asia | 93.1 /100 | #130 | Exceptional 8.7% |
| Slavs | 92.2 /100 | #131 | Exceptional 8.7% |
| Yaqui | 92.2 /100 | #132 | Exceptional 8.7% |
| Egyptians | 91.8 /100 | #133 | Exceptional 8.7% |
| Immigrants | Ireland | 91.0 /100 | #134 | Exceptional 8.7% |
| Europeans | 90.6 /100 | #135 | Exceptional 8.7% |
| Immigrants | Latvia | 90.4 /100 | #136 | Exceptional 8.7% |
| Immigrants | Argentina | 90.0 /100 | #137 | Excellent 8.7% |
| Immigrants | Ethiopia | 89.5 /100 | #138 | Excellent 8.8% |
| Northern Europeans | 89.2 /100 | #139 | Excellent 8.8% |
| Immigrants | Poland | 88.3 /100 | #140 | Excellent 8.8% |
| Serbians | 87.6 /100 | #141 | Excellent 8.8% |
| Immigrants | Austria | 87.5 /100 | #142 | Excellent 8.8% |
Demographics Similar to Jamaicans by Unemployment Among Women with Children Ages 6 to 17 years
In terms of unemployment among women with children ages 6 to 17 years, the demographic groups most similar to Jamaicans are Slovak (9.8%, a difference of 0.23%), Seminole (9.7%, a difference of 0.53%), Scotch-Irish (9.7%, a difference of 0.72%), French (9.7%, a difference of 0.75%), and British West Indian (9.7%, a difference of 0.82%).
| Demographics | Rating | Rank | Unemployment Among Women with Children Ages 6 to 17 years |
| Aleuts | 0.1 /100 | #274 | Tragic 9.6% |
| U.S. Virgin Islanders | 0.1 /100 | #275 | Tragic 9.7% |
| Immigrants | Portugal | 0.1 /100 | #276 | Tragic 9.7% |
| British West Indians | 0.1 /100 | #277 | Tragic 9.7% |
| French | 0.1 /100 | #278 | Tragic 9.7% |
| Scotch-Irish | 0.1 /100 | #279 | Tragic 9.7% |
| Seminole | 0.1 /100 | #280 | Tragic 9.7% |
| Jamaicans | 0.0 /100 | #281 | Tragic 9.8% |
| Slovaks | 0.0 /100 | #282 | Tragic 9.8% |
| Central American Indians | 0.0 /100 | #283 | Tragic 9.9% |
| Yakama | 0.0 /100 | #284 | Tragic 9.9% |
| Hispanics or Latinos | 0.0 /100 | #285 | Tragic 9.9% |
| Choctaw | 0.0 /100 | #286 | Tragic 9.9% |
| Sierra Leoneans | 0.0 /100 | #287 | Tragic 9.9% |
| Shoshone | 0.0 /100 | #288 | Tragic 10.0% |