Mexican American Indian vs Immigrants from Mexico Unemployment Among Women with Children Ages 6 to 17 years
COMPARE
Mexican American Indian
Immigrants from Mexico
Unemployment Among Women with Children Ages 6 to 17 years
Unemployment Among Women with Children Ages 6 to 17 years Comparison
Mexican American Indians
Immigrants from Mexico
8.9%
UNEMPLOYMENT AMONG WOMEN WITH CHILDREN AGES 6 TO 17 YEARS
60.6/ 100
METRIC RATING
163rd/ 347
METRIC RANK
9.5%
UNEMPLOYMENT AMONG WOMEN WITH CHILDREN AGES 6 TO 17 YEARS
0.7/ 100
METRIC RATING
258th/ 347
METRIC RANK
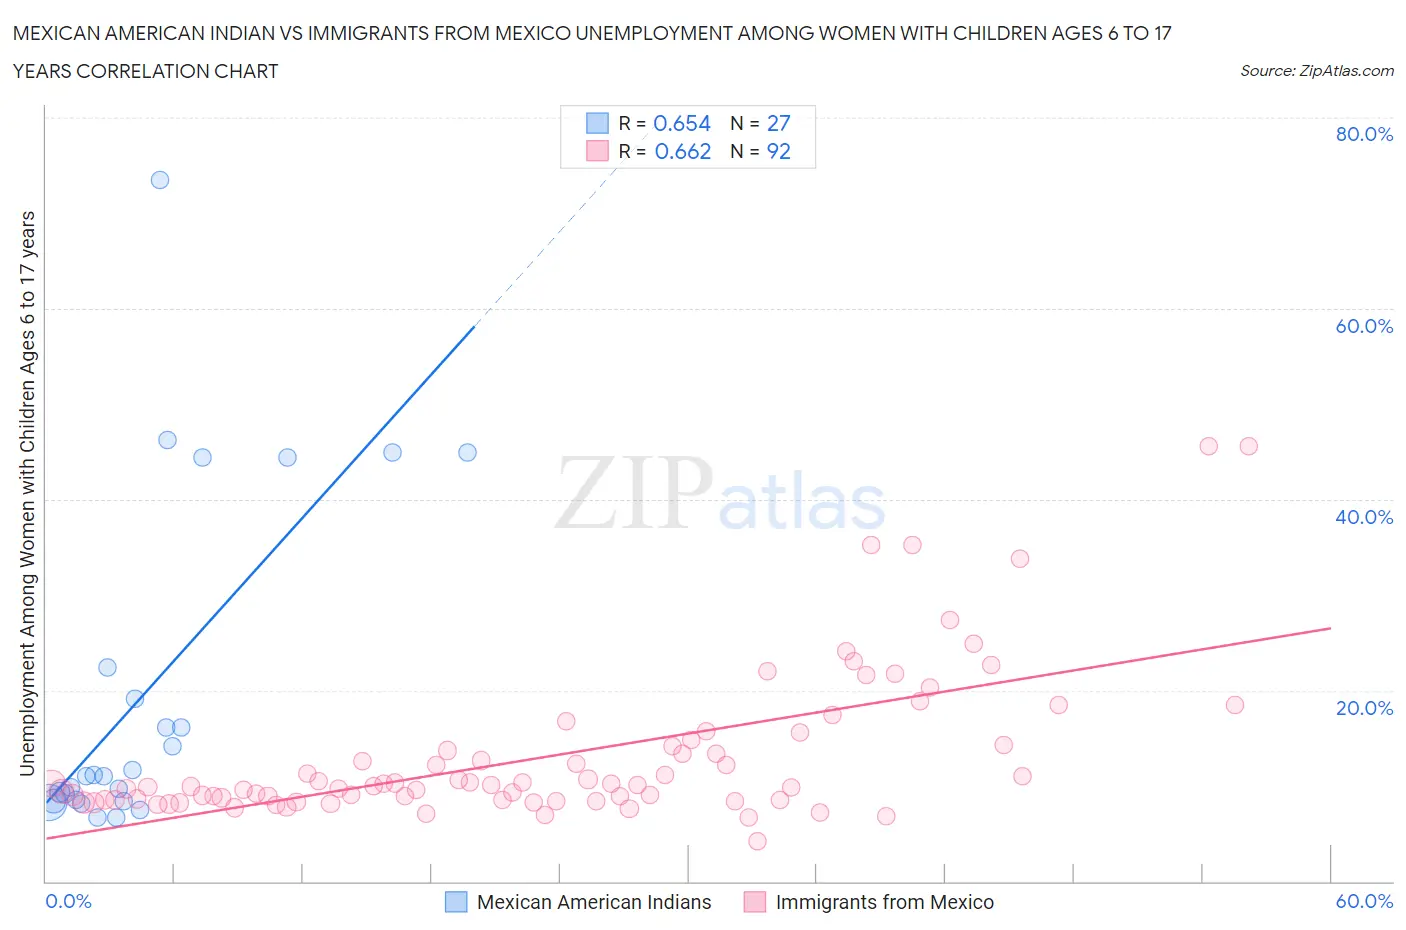
Mexican American Indian vs Immigrants from Mexico Unemployment Among Women with Children Ages 6 to 17 years Correlation Chart
The statistical analysis conducted on geographies consisting of 246,437,451 people shows a significant positive correlation between the proportion of Mexican American Indians and unemployment rate among women with children between the ages 6 and 17 in the United States with a correlation coefficient (R) of 0.654 and weighted average of 8.9%. Similarly, the statistical analysis conducted on geographies consisting of 342,553,343 people shows a significant positive correlation between the proportion of Immigrants from Mexico and unemployment rate among women with children between the ages 6 and 17 in the United States with a correlation coefficient (R) of 0.662 and weighted average of 9.5%, a difference of 6.0%.
Unemployment Among Women with Children Ages 6 to 17 years Correlation Summary
| Measurement | Mexican American Indian | Immigrants from Mexico |
| Minimum | 6.6% | 4.2% |
| Maximum | 73.5% | 45.5% |
| Range | 66.9% | 41.3% |
| Mean | 19.7% | 13.1% |
| Median | 11.0% | 10.0% |
| Interquartile 25% (IQ1) | 8.4% | 8.5% |
| Interquartile 75% (IQ3) | 22.4% | 14.2% |
| Interquartile Range (IQR) | 14.0% | 5.7% |
| Standard Deviation (Sample) | 17.5% | 7.9% |
| Standard Deviation (Population) | 17.2% | 7.9% |
Similar Demographics by Unemployment Among Women with Children Ages 6 to 17 years
Demographics Similar to Mexican American Indians by Unemployment Among Women with Children Ages 6 to 17 years
In terms of unemployment among women with children ages 6 to 17 years, the demographic groups most similar to Mexican American Indians are Immigrants from Netherlands (8.9%, a difference of 0.010%), Ukrainian (8.9%, a difference of 0.040%), Immigrants from Micronesia (8.9%, a difference of 0.060%), Moroccan (8.9%, a difference of 0.10%), and Immigrants from Guyana (8.9%, a difference of 0.11%).
| Demographics | Rating | Rank | Unemployment Among Women with Children Ages 6 to 17 years |
| Osage | 65.9 /100 | #156 | Good 8.9% |
| Immigrants | Belgium | 65.6 /100 | #157 | Good 8.9% |
| Immigrants | Chile | 65.3 /100 | #158 | Good 8.9% |
| Spanish | 63.8 /100 | #159 | Good 8.9% |
| Immigrants | Hungary | 63.4 /100 | #160 | Good 8.9% |
| Immigrants | Guyana | 63.0 /100 | #161 | Good 8.9% |
| Immigrants | Netherlands | 60.8 /100 | #162 | Good 8.9% |
| Mexican American Indians | 60.6 /100 | #163 | Good 8.9% |
| Ukrainians | 59.7 /100 | #164 | Average 8.9% |
| Immigrants | Micronesia | 59.2 /100 | #165 | Average 8.9% |
| Moroccans | 58.3 /100 | #166 | Average 8.9% |
| Immigrants | England | 57.7 /100 | #167 | Average 8.9% |
| Immigrants | Croatia | 57.1 /100 | #168 | Average 8.9% |
| British | 55.2 /100 | #169 | Average 8.9% |
| Turks | 54.1 /100 | #170 | Average 8.9% |
Demographics Similar to Immigrants from Mexico by Unemployment Among Women with Children Ages 6 to 17 years
In terms of unemployment among women with children ages 6 to 17 years, the demographic groups most similar to Immigrants from Mexico are Celtic (9.5%, a difference of 0.090%), Immigrants from Central America (9.5%, a difference of 0.090%), Canadian (9.4%, a difference of 0.11%), Italian (9.5%, a difference of 0.21%), and Lithuanian (9.4%, a difference of 0.28%).
| Demographics | Rating | Rank | Unemployment Among Women with Children Ages 6 to 17 years |
| Central Americans | 1.3 /100 | #251 | Tragic 9.4% |
| Creek | 1.2 /100 | #252 | Tragic 9.4% |
| Portuguese | 1.1 /100 | #253 | Tragic 9.4% |
| Nicaraguans | 1.0 /100 | #254 | Tragic 9.4% |
| Lithuanians | 0.9 /100 | #255 | Tragic 9.4% |
| Canadians | 0.8 /100 | #256 | Tragic 9.4% |
| Celtics | 0.7 /100 | #257 | Tragic 9.5% |
| Immigrants | Mexico | 0.7 /100 | #258 | Tragic 9.5% |
| Immigrants | Central America | 0.6 /100 | #259 | Tragic 9.5% |
| Italians | 0.6 /100 | #260 | Tragic 9.5% |
| South Americans | 0.5 /100 | #261 | Tragic 9.5% |
| Senegalese | 0.5 /100 | #262 | Tragic 9.5% |
| Lebanese | 0.5 /100 | #263 | Tragic 9.5% |
| Immigrants | Ghana | 0.4 /100 | #264 | Tragic 9.5% |
| West Indians | 0.4 /100 | #265 | Tragic 9.5% |