Mexican American Indian vs Jamaican 4th Grade
COMPARE
Mexican American Indian
Jamaican
4th Grade
4th Grade Comparison
Mexican American Indians
Jamaicans
95.8%
4TH GRADE
0.0/ 100
METRIC RATING
328th/ 347
METRIC RANK
97.1%
4TH GRADE
0.8/ 100
METRIC RATING
252nd/ 347
METRIC RANK
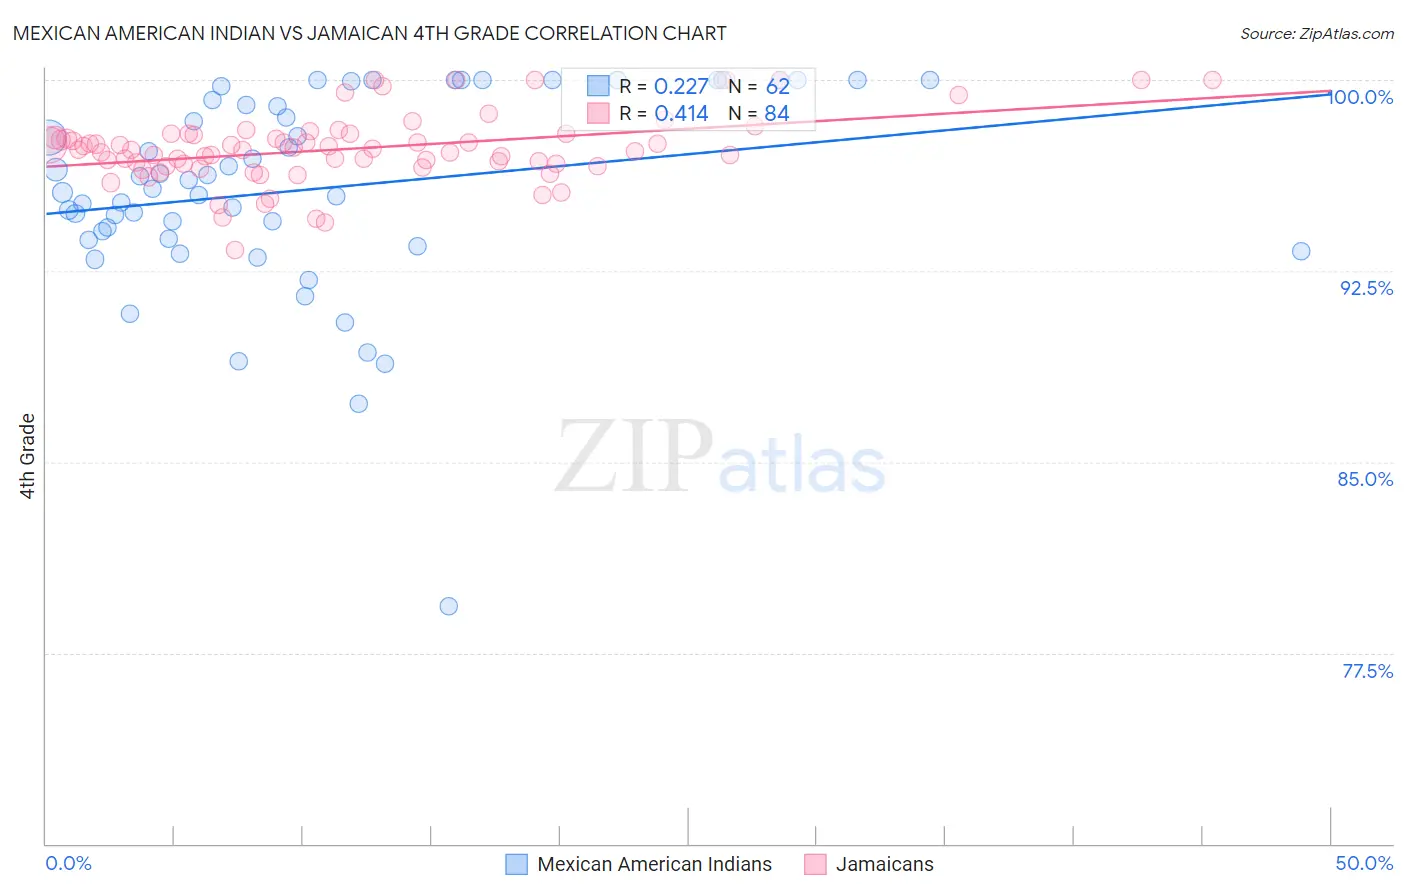
Mexican American Indian vs Jamaican 4th Grade Correlation Chart
The statistical analysis conducted on geographies consisting of 317,621,104 people shows a weak positive correlation between the proportion of Mexican American Indians and percentage of population with at least 4th grade education in the United States with a correlation coefficient (R) of 0.227 and weighted average of 95.8%. Similarly, the statistical analysis conducted on geographies consisting of 368,084,189 people shows a moderate positive correlation between the proportion of Jamaicans and percentage of population with at least 4th grade education in the United States with a correlation coefficient (R) of 0.414 and weighted average of 97.1%, a difference of 1.3%.
4th Grade Correlation Summary
| Measurement | Mexican American Indian | Jamaican |
| Minimum | 79.3% | 93.3% |
| Maximum | 100.0% | 100.0% |
| Range | 20.7% | 6.7% |
| Mean | 95.7% | 97.3% |
| Median | 95.9% | 97.3% |
| Interquartile 25% (IQ1) | 93.8% | 96.7% |
| Interquartile 75% (IQ3) | 99.2% | 97.9% |
| Interquartile Range (IQR) | 5.5% | 1.2% |
| Standard Deviation (Sample) | 3.9% | 1.3% |
| Standard Deviation (Population) | 3.9% | 1.3% |
Similar Demographics by 4th Grade
Demographics Similar to Mexican American Indians by 4th Grade
In terms of 4th grade, the demographic groups most similar to Mexican American Indians are Immigrants from Cambodia (95.8%, a difference of 0.010%), Immigrants from Fiji (95.8%, a difference of 0.020%), Immigrants from Armenia (95.8%, a difference of 0.070%), Immigrants from Honduras (95.8%, a difference of 0.080%), and Honduran (96.0%, a difference of 0.11%).
| Demographics | Rating | Rank | 4th Grade |
| Japanese | 0.0 /100 | #321 | Tragic 96.0% |
| Immigrants | Vietnam | 0.0 /100 | #322 | Tragic 96.0% |
| Immigrants | Nicaragua | 0.0 /100 | #323 | Tragic 96.0% |
| Immigrants | Belize | 0.0 /100 | #324 | Tragic 96.0% |
| Dominicans | 0.0 /100 | #325 | Tragic 96.0% |
| Hispanics or Latinos | 0.0 /100 | #326 | Tragic 96.0% |
| Hondurans | 0.0 /100 | #327 | Tragic 96.0% |
| Mexican American Indians | 0.0 /100 | #328 | Tragic 95.8% |
| Immigrants | Cambodia | 0.0 /100 | #329 | Tragic 95.8% |
| Immigrants | Fiji | 0.0 /100 | #330 | Tragic 95.8% |
| Immigrants | Armenia | 0.0 /100 | #331 | Tragic 95.8% |
| Immigrants | Honduras | 0.0 /100 | #332 | Tragic 95.8% |
| Immigrants | Dominican Republic | 0.0 /100 | #333 | Tragic 95.7% |
| Immigrants | Cabo Verde | 0.0 /100 | #334 | Tragic 95.7% |
| Immigrants | Latin America | 0.0 /100 | #335 | Tragic 95.7% |
Demographics Similar to Jamaicans by 4th Grade
In terms of 4th grade, the demographic groups most similar to Jamaicans are South American (97.1%, a difference of 0.0%), Immigrants from Liberia (97.1%, a difference of 0.0%), Immigrants from Middle Africa (97.1%, a difference of 0.0%), Immigrants from Africa (97.1%, a difference of 0.010%), and Immigrants from Senegal (97.1%, a difference of 0.010%).
| Demographics | Rating | Rank | 4th Grade |
| Immigrants | Eastern Africa | 1.2 /100 | #245 | Tragic 97.1% |
| Immigrants | Uruguay | 1.2 /100 | #246 | Tragic 97.1% |
| Ethiopians | 1.2 /100 | #247 | Tragic 97.1% |
| Immigrants | Asia | 1.2 /100 | #248 | Tragic 97.1% |
| Immigrants | Africa | 1.0 /100 | #249 | Tragic 97.1% |
| Immigrants | Senegal | 0.9 /100 | #250 | Tragic 97.1% |
| South Americans | 0.8 /100 | #251 | Tragic 97.1% |
| Jamaicans | 0.8 /100 | #252 | Tragic 97.1% |
| Immigrants | Liberia | 0.8 /100 | #253 | Tragic 97.1% |
| Immigrants | Middle Africa | 0.8 /100 | #254 | Tragic 97.1% |
| Peruvians | 0.7 /100 | #255 | Tragic 97.1% |
| Bolivians | 0.7 /100 | #256 | Tragic 97.1% |
| Immigrants | Congo | 0.5 /100 | #257 | Tragic 97.0% |
| Immigrants | Colombia | 0.5 /100 | #258 | Tragic 97.0% |
| Immigrants | Ethiopia | 0.4 /100 | #259 | Tragic 97.0% |