Menominee vs Alaskan Athabascan Unemployment Among Women with Children Under 6 years
COMPARE
Menominee
Alaskan Athabascan
Unemployment Among Women with Children Under 6 years
Unemployment Among Women with Children Under 6 years Comparison
Menominee
Alaskan Athabascans
8.7%
UNEMPLOYMENT AMONG WOMEN WITH CHILDREN UNDER 6 YEARS
0.0/ 100
METRIC RATING
287th/ 347
METRIC RANK
9.1%
UNEMPLOYMENT AMONG WOMEN WITH CHILDREN UNDER 6 YEARS
0.0/ 100
METRIC RATING
305th/ 347
METRIC RANK
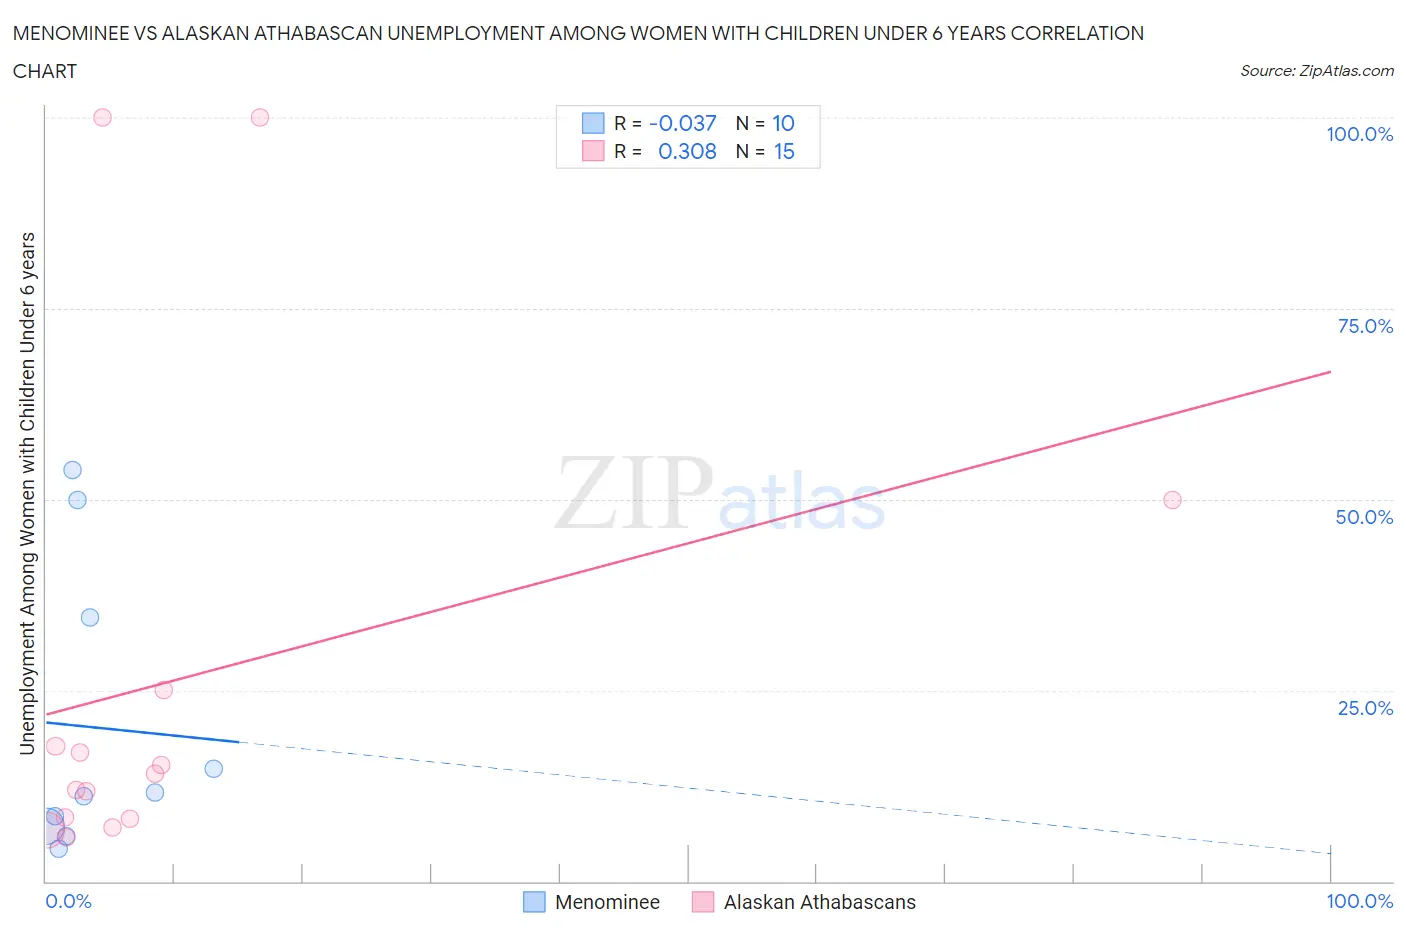
Menominee vs Alaskan Athabascan Unemployment Among Women with Children Under 6 years Correlation Chart
The statistical analysis conducted on geographies consisting of 41,178,371 people shows no correlation between the proportion of Menominee and unemployment rate among women with children under the age of 6 in the United States with a correlation coefficient (R) of -0.037 and weighted average of 8.7%. Similarly, the statistical analysis conducted on geographies consisting of 41,393,771 people shows a mild positive correlation between the proportion of Alaskan Athabascans and unemployment rate among women with children under the age of 6 in the United States with a correlation coefficient (R) of 0.308 and weighted average of 9.1%, a difference of 4.4%.
Unemployment Among Women with Children Under 6 years Correlation Summary
| Measurement | Menominee | Alaskan Athabascan |
| Minimum | 4.2% | 5.7% |
| Maximum | 53.8% | 100.0% |
| Range | 49.6% | 94.3% |
| Mean | 20.2% | 26.6% |
| Median | 11.3% | 14.1% |
| Interquartile 25% (IQ1) | 7.2% | 8.2% |
| Interquartile 75% (IQ3) | 34.6% | 25.0% |
| Interquartile Range (IQR) | 27.4% | 16.8% |
| Standard Deviation (Sample) | 18.8% | 31.7% |
| Standard Deviation (Population) | 17.8% | 30.7% |
Demographics Similar to Menominee and Alaskan Athabascans by Unemployment Among Women with Children Under 6 years
In terms of unemployment among women with children under 6 years, the demographic groups most similar to Menominee are Seminole (8.7%, a difference of 0.15%), Bahamian (8.7%, a difference of 0.20%), Iroquois (8.7%, a difference of 0.31%), Vietnamese (8.8%, a difference of 0.46%), and Jamaican (8.8%, a difference of 0.90%). Similarly, the demographic groups most similar to Alaskan Athabascans are Pueblo (9.1%, a difference of 0.17%), Immigrants from Mexico (9.1%, a difference of 0.41%), Immigrants from West Indies (9.0%, a difference of 0.55%), Hispanic or Latino (9.0%, a difference of 0.58%), and Chickasaw (9.0%, a difference of 1.5%).
| Demographics | Rating | Rank | Unemployment Among Women with Children Under 6 years |
| Seminole | 0.0 /100 | #286 | Tragic 8.7% |
| Menominee | 0.0 /100 | #287 | Tragic 8.7% |
| Bahamians | 0.0 /100 | #288 | Tragic 8.7% |
| Iroquois | 0.0 /100 | #289 | Tragic 8.7% |
| Vietnamese | 0.0 /100 | #290 | Tragic 8.8% |
| Jamaicans | 0.0 /100 | #291 | Tragic 8.8% |
| Cheyenne | 0.0 /100 | #292 | Tragic 8.8% |
| Immigrants | Bangladesh | 0.0 /100 | #293 | Tragic 8.8% |
| Immigrants | Nonimmigrants | 0.0 /100 | #294 | Tragic 8.8% |
| Immigrants | Central America | 0.0 /100 | #295 | Tragic 8.9% |
| Immigrants | Dominican Republic | 0.0 /100 | #296 | Tragic 8.9% |
| Mexicans | 0.0 /100 | #297 | Tragic 8.9% |
| Tlingit-Haida | 0.0 /100 | #298 | Tragic 8.9% |
| Immigrants | Jamaica | 0.0 /100 | #299 | Tragic 8.9% |
| Creek | 0.0 /100 | #300 | Tragic 8.9% |
| Chickasaw | 0.0 /100 | #301 | Tragic 9.0% |
| Hispanics or Latinos | 0.0 /100 | #302 | Tragic 9.0% |
| Immigrants | West Indies | 0.0 /100 | #303 | Tragic 9.0% |
| Immigrants | Mexico | 0.0 /100 | #304 | Tragic 9.1% |
| Alaskan Athabascans | 0.0 /100 | #305 | Tragic 9.1% |
| Pueblo | 0.0 /100 | #306 | Tragic 9.1% |