Menominee vs Sioux Unemployment Among Women with Children Under 6 years
COMPARE
Menominee
Sioux
Unemployment Among Women with Children Under 6 years
Unemployment Among Women with Children Under 6 years Comparison
Menominee
Sioux
8.7%
UNEMPLOYMENT AMONG WOMEN WITH CHILDREN UNDER 6 YEARS
0.0/ 100
METRIC RATING
287th/ 347
METRIC RANK
11.5%
UNEMPLOYMENT AMONG WOMEN WITH CHILDREN UNDER 6 YEARS
0.0/ 100
METRIC RATING
332nd/ 347
METRIC RANK
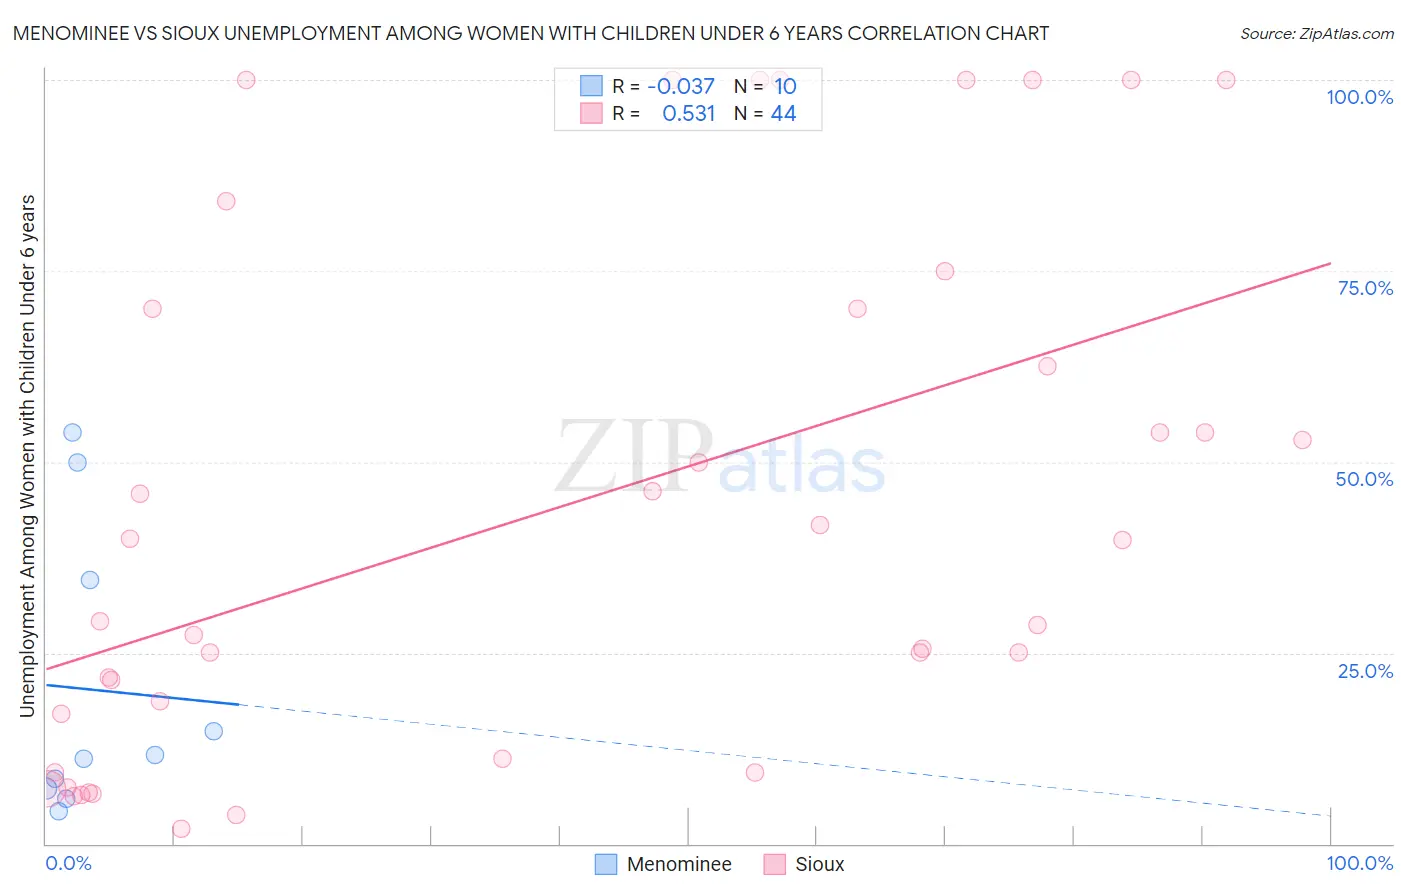
Menominee vs Sioux Unemployment Among Women with Children Under 6 years Correlation Chart
The statistical analysis conducted on geographies consisting of 41,178,371 people shows no correlation between the proportion of Menominee and unemployment rate among women with children under the age of 6 in the United States with a correlation coefficient (R) of -0.037 and weighted average of 8.7%. Similarly, the statistical analysis conducted on geographies consisting of 190,203,570 people shows a substantial positive correlation between the proportion of Sioux and unemployment rate among women with children under the age of 6 in the United States with a correlation coefficient (R) of 0.531 and weighted average of 11.5%, a difference of 31.5%.
Unemployment Among Women with Children Under 6 years Correlation Summary
| Measurement | Menominee | Sioux |
| Minimum | 4.2% | 2.0% |
| Maximum | 53.8% | 100.0% |
| Range | 49.6% | 98.0% |
| Mean | 20.2% | 43.8% |
| Median | 11.3% | 34.5% |
| Interquartile 25% (IQ1) | 7.2% | 14.1% |
| Interquartile 75% (IQ3) | 34.6% | 70.0% |
| Interquartile Range (IQR) | 27.4% | 55.9% |
| Standard Deviation (Sample) | 18.8% | 33.9% |
| Standard Deviation (Population) | 17.8% | 33.5% |
Similar Demographics by Unemployment Among Women with Children Under 6 years
Demographics Similar to Menominee by Unemployment Among Women with Children Under 6 years
In terms of unemployment among women with children under 6 years, the demographic groups most similar to Menominee are U.S. Virgin Islander (8.7%, a difference of 0.15%), Seminole (8.7%, a difference of 0.15%), Bahamian (8.7%, a difference of 0.20%), Iroquois (8.7%, a difference of 0.31%), and Blackfeet (8.7%, a difference of 0.35%).
| Demographics | Rating | Rank | Unemployment Among Women with Children Under 6 years |
| Immigrants | Belize | 0.0 /100 | #280 | Tragic 8.6% |
| Guatemalans | 0.0 /100 | #281 | Tragic 8.7% |
| Bermudans | 0.0 /100 | #282 | Tragic 8.7% |
| Spanish American Indians | 0.0 /100 | #283 | Tragic 8.7% |
| Blackfeet | 0.0 /100 | #284 | Tragic 8.7% |
| U.S. Virgin Islanders | 0.0 /100 | #285 | Tragic 8.7% |
| Seminole | 0.0 /100 | #286 | Tragic 8.7% |
| Menominee | 0.0 /100 | #287 | Tragic 8.7% |
| Bahamians | 0.0 /100 | #288 | Tragic 8.7% |
| Iroquois | 0.0 /100 | #289 | Tragic 8.7% |
| Vietnamese | 0.0 /100 | #290 | Tragic 8.8% |
| Jamaicans | 0.0 /100 | #291 | Tragic 8.8% |
| Cheyenne | 0.0 /100 | #292 | Tragic 8.8% |
| Immigrants | Bangladesh | 0.0 /100 | #293 | Tragic 8.8% |
| Immigrants | Nonimmigrants | 0.0 /100 | #294 | Tragic 8.8% |
Demographics Similar to Sioux by Unemployment Among Women with Children Under 6 years
In terms of unemployment among women with children under 6 years, the demographic groups most similar to Sioux are Native/Alaskan (11.5%, a difference of 0.56%), Colville (11.2%, a difference of 2.7%), Pennsylvania German (10.8%, a difference of 6.4%), Apache (12.3%, a difference of 7.5%), and Puerto Rican (12.5%, a difference of 9.5%).
| Demographics | Rating | Rank | Unemployment Among Women with Children Under 6 years |
| Choctaw | 0.0 /100 | #325 | Tragic 9.8% |
| Delaware | 0.0 /100 | #326 | Tragic 9.8% |
| Ottawa | 0.0 /100 | #327 | Tragic 9.9% |
| Tohono O'odham | 0.0 /100 | #328 | Tragic 10.2% |
| Blacks/African Americans | 0.0 /100 | #329 | Tragic 10.3% |
| Pennsylvania Germans | 0.0 /100 | #330 | Tragic 10.8% |
| Colville | 0.0 /100 | #331 | Tragic 11.2% |
| Sioux | 0.0 /100 | #332 | Tragic 11.5% |
| Natives/Alaskans | 0.0 /100 | #333 | Tragic 11.5% |
| Apache | 0.0 /100 | #334 | Tragic 12.3% |
| Puerto Ricans | 0.0 /100 | #335 | Tragic 12.5% |
| Shoshone | 0.0 /100 | #336 | Tragic 13.2% |
| Chippewa | 0.0 /100 | #337 | Tragic 13.3% |
| Pima | 0.0 /100 | #338 | Tragic 13.4% |
| Navajo | 0.0 /100 | #339 | Tragic 13.5% |