Menominee vs Croatian Unemployment Among Women with Children Under 6 years
COMPARE
Menominee
Croatian
Unemployment Among Women with Children Under 6 years
Unemployment Among Women with Children Under 6 years Comparison
Menominee
Croatians
8.7%
UNEMPLOYMENT AMONG WOMEN WITH CHILDREN UNDER 6 YEARS
0.0/ 100
METRIC RATING
287th/ 347
METRIC RANK
7.5%
UNEMPLOYMENT AMONG WOMEN WITH CHILDREN UNDER 6 YEARS
71.9/ 100
METRIC RATING
158th/ 347
METRIC RANK
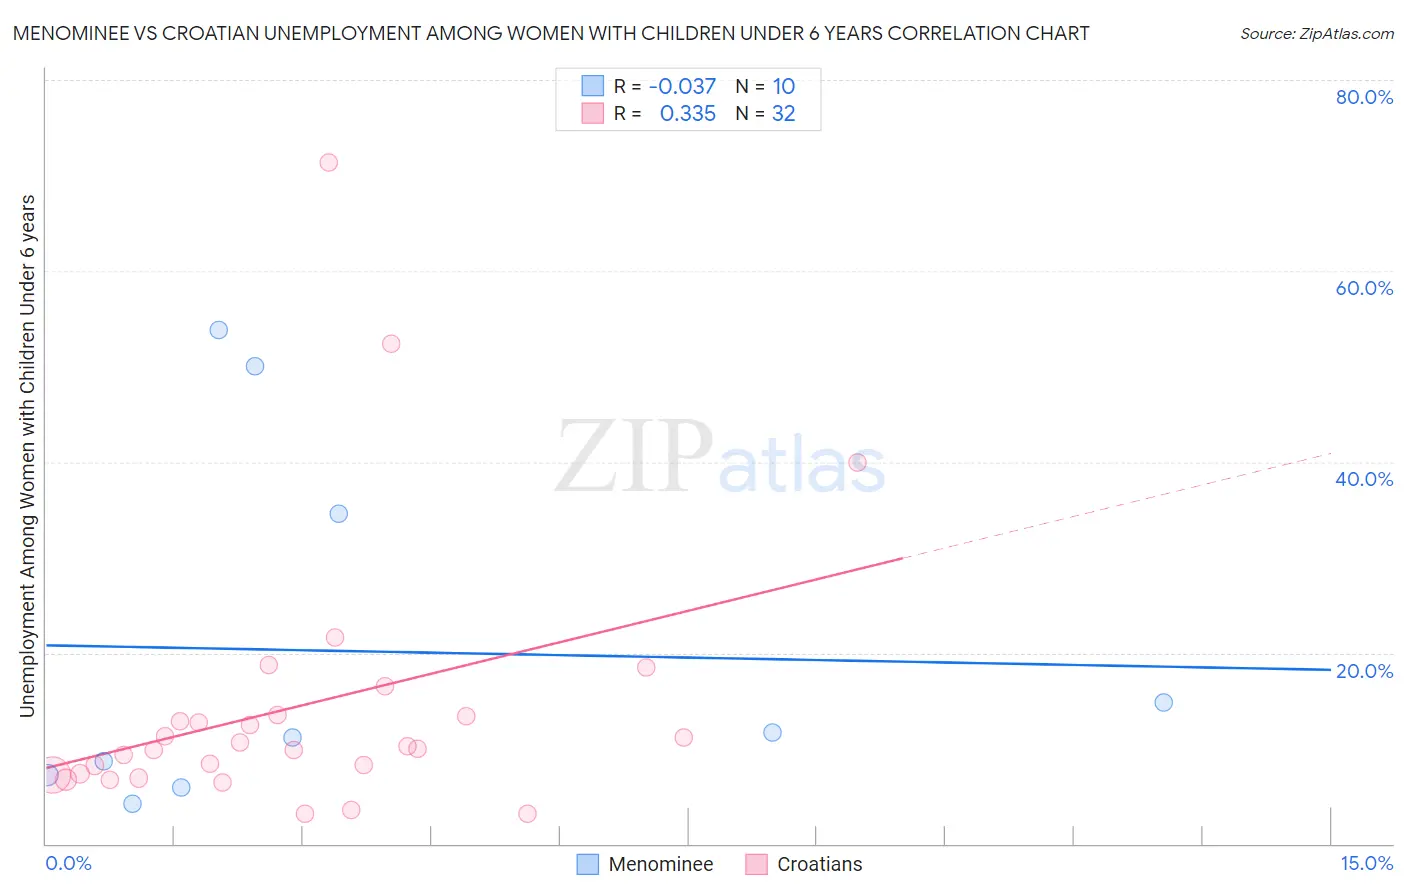
Menominee vs Croatian Unemployment Among Women with Children Under 6 years Correlation Chart
The statistical analysis conducted on geographies consisting of 41,178,371 people shows no correlation between the proportion of Menominee and unemployment rate among women with children under the age of 6 in the United States with a correlation coefficient (R) of -0.037 and weighted average of 8.7%. Similarly, the statistical analysis conducted on geographies consisting of 279,151,645 people shows a mild positive correlation between the proportion of Croatians and unemployment rate among women with children under the age of 6 in the United States with a correlation coefficient (R) of 0.335 and weighted average of 7.5%, a difference of 15.8%.
Unemployment Among Women with Children Under 6 years Correlation Summary
| Measurement | Menominee | Croatian |
| Minimum | 4.2% | 3.1% |
| Maximum | 53.8% | 71.4% |
| Range | 49.6% | 68.3% |
| Mean | 20.2% | 14.4% |
| Median | 11.3% | 10.1% |
| Interquartile 25% (IQ1) | 7.2% | 7.3% |
| Interquartile 75% (IQ3) | 34.6% | 13.4% |
| Interquartile Range (IQR) | 27.4% | 6.1% |
| Standard Deviation (Sample) | 18.8% | 14.4% |
| Standard Deviation (Population) | 17.8% | 14.2% |
Similar Demographics by Unemployment Among Women with Children Under 6 years
Demographics Similar to Menominee by Unemployment Among Women with Children Under 6 years
In terms of unemployment among women with children under 6 years, the demographic groups most similar to Menominee are U.S. Virgin Islander (8.7%, a difference of 0.15%), Seminole (8.7%, a difference of 0.15%), Bahamian (8.7%, a difference of 0.20%), Iroquois (8.7%, a difference of 0.31%), and Blackfeet (8.7%, a difference of 0.35%).
| Demographics | Rating | Rank | Unemployment Among Women with Children Under 6 years |
| Immigrants | Belize | 0.0 /100 | #280 | Tragic 8.6% |
| Guatemalans | 0.0 /100 | #281 | Tragic 8.7% |
| Bermudans | 0.0 /100 | #282 | Tragic 8.7% |
| Spanish American Indians | 0.0 /100 | #283 | Tragic 8.7% |
| Blackfeet | 0.0 /100 | #284 | Tragic 8.7% |
| U.S. Virgin Islanders | 0.0 /100 | #285 | Tragic 8.7% |
| Seminole | 0.0 /100 | #286 | Tragic 8.7% |
| Menominee | 0.0 /100 | #287 | Tragic 8.7% |
| Bahamians | 0.0 /100 | #288 | Tragic 8.7% |
| Iroquois | 0.0 /100 | #289 | Tragic 8.7% |
| Vietnamese | 0.0 /100 | #290 | Tragic 8.8% |
| Jamaicans | 0.0 /100 | #291 | Tragic 8.8% |
| Cheyenne | 0.0 /100 | #292 | Tragic 8.8% |
| Immigrants | Bangladesh | 0.0 /100 | #293 | Tragic 8.8% |
| Immigrants | Nonimmigrants | 0.0 /100 | #294 | Tragic 8.8% |
Demographics Similar to Croatians by Unemployment Among Women with Children Under 6 years
In terms of unemployment among women with children under 6 years, the demographic groups most similar to Croatians are Peruvian (7.5%, a difference of 0.030%), Immigrants from Philippines (7.5%, a difference of 0.050%), Bolivian (7.5%, a difference of 0.090%), Immigrants from Southern Europe (7.5%, a difference of 0.11%), and Immigrants from Western Asia (7.5%, a difference of 0.14%).
| Demographics | Rating | Rank | Unemployment Among Women with Children Under 6 years |
| Immigrants | Peru | 74.9 /100 | #151 | Good 7.5% |
| Bangladeshis | 74.8 /100 | #152 | Good 7.5% |
| Uruguayans | 74.7 /100 | #153 | Good 7.5% |
| Northern Europeans | 74.3 /100 | #154 | Good 7.5% |
| South Americans | 74.1 /100 | #155 | Good 7.5% |
| Immigrants | Southern Europe | 73.2 /100 | #156 | Good 7.5% |
| Peruvians | 72.3 /100 | #157 | Good 7.5% |
| Croatians | 71.9 /100 | #158 | Good 7.5% |
| Immigrants | Philippines | 71.3 /100 | #159 | Good 7.5% |
| Bolivians | 70.8 /100 | #160 | Good 7.5% |
| Immigrants | Western Asia | 70.2 /100 | #161 | Good 7.5% |
| Immigrants | Lithuania | 68.8 /100 | #162 | Good 7.5% |
| British | 66.3 /100 | #163 | Good 7.6% |
| Ugandans | 65.8 /100 | #164 | Good 7.6% |
| Immigrants | South America | 65.6 /100 | #165 | Good 7.6% |